Community Tip - Your Friends List is a way to easily have access to the community members that you interact with the most! X
- Subscribe to RSS Feed
- Mark Topic as New
- Mark Topic as Read
- Float this Topic for Current User
- Bookmark
- Subscribe
- Mute
- Printer Friendly Page
Iregular polygon-area
- Mark as New
- Bookmark
- Subscribe
- Mute
- Subscribe to RSS Feed
- Permalink
- Notify Moderator
Iregular polygon-area
Hi,
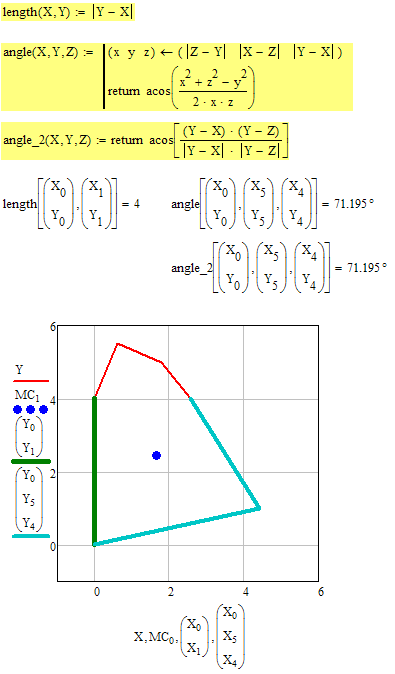
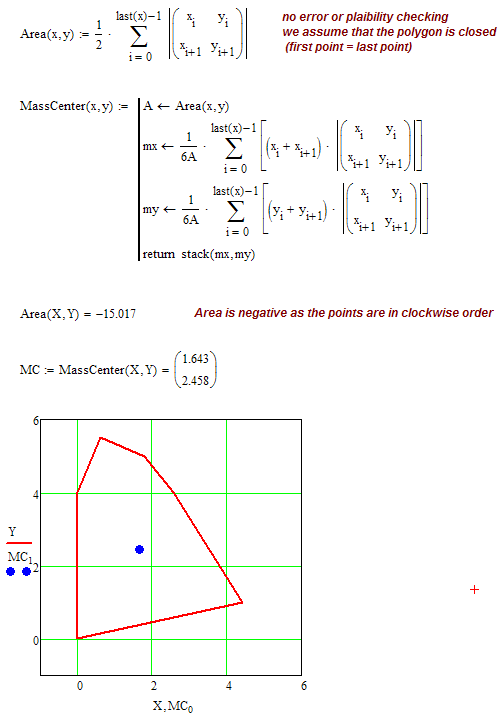
How can I determine the area and center of mass of a polygon knowing the coordinates of its points? the lenght of the segment 01 and the angle between lines 05 and 45?
Thank you,
Gabriel
Solved! Go to Solution.
Accepted Solutions
- Mark as New
- Bookmark
- Subscribe
- Mute
- Subscribe to RSS Feed
- Permalink
- Notify Moderator
For whatever it may be worth, here is a much more compact version of the intersect() routine. One of those "why didn't I thought of that before" things.
- Mark as New
- Bookmark
- Subscribe
- Mute
- Subscribe to RSS Feed
- Permalink
- Notify Moderator
- Mark as New
- Bookmark
- Subscribe
- Mute
- Subscribe to RSS Feed
- Permalink
- Notify Moderator
- Mark as New
- Bookmark
- Subscribe
- Mute
- Subscribe to RSS Feed
- Permalink
- Notify Moderator
- Mark as New
- Bookmark
- Subscribe
- Mute
- Subscribe to RSS Feed
- Permalink
- Notify Moderator
Well done Werner. Fred and I both forgot about the CofG part!
Alan
- Mark as New
- Bookmark
- Subscribe
- Mute
- Subscribe to RSS Feed
- Permalink
- Notify Moderator
Well done Werner. Fred and I both forgot about the CofG part!
Looks like we all forgot about the second question
the lenght of the segment 01 and the angle between lines 05 and 45?
but I am not quite sure about this question, especially as the first part seems too trivial.

- Mark as New
- Bookmark
- Subscribe
- Mute
- Subscribe to RSS Feed
- Permalink
- Notify Moderator
Thank you gentlemen,
I'm not a regular matchad user, but whenever I search on this forum I see solutions from some of you guys. Thank you for sharing your experiece with us!
Werner, the angle was part of a second questions. It will follow. Now I have to run to a meeting.
regards,
Gabriel
- Mark as New
- Bookmark
- Subscribe
- Mute
- Subscribe to RSS Feed
- Permalink
- Notify Moderator
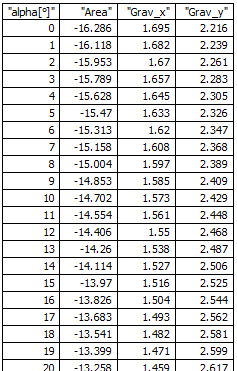
I tried, without any success, to extend the solutions proposed so that I can account for the variability of the angle alfa. I inserted an explanatory figure at the end of the worksheet. If alfa is 0 line 05 is horizontal. The top limit of alfa is defined by joining points 4 and 5. I would like to define alfa as a incremental variable within these limits. Line 45 has fixed slope (beta angle).
The idea is to make point 5 run on the 45 line and consequently generate values of the area and center of gravity for a fixed increment of alfa.
E.g. if alfa ranges between 0 and 10 deg, I would like to calculate for each degree of alfa the area and center of mass.
Thank you for all your good input.
Greetings,
Gabriel
- Mark as New
- Bookmark
- Subscribe
- Mute
- Subscribe to RSS Feed
- Permalink
- Notify Moderator
With thanks to Werner for doing the hard work:
- Mark as New
- Bookmark
- Subscribe
- Mute
- Subscribe to RSS Feed
- Permalink
- Notify Moderator
Fred Kohlhepp wrote:
With thanks to Werner for doing the hard work:
Fortunately it wasn't that hard a work 😉
Its surprising that something simple like the intersection of two straight lines can make much more work, especially if it should not fail at vertical lines.
See attached my attempt along with a little animation.

Afterthought: The path of the center of gravity seems to be a hyperbola. At least thats what I get if I calculate the path for -180° to 180°

AGAIN! It seems that this happens always around that time!? WHen I edit a post and attach a pic it looks OK, but after Updating the pic is not seen!
I attach it as a file.
- Mark as New
- Bookmark
- Subscribe
- Mute
- Subscribe to RSS Feed
- Permalink
- Notify Moderator
Gabriel's problem statement said that point 5 was to be constrained to the 4 - 5 line and the problem terminated when point 5 coincided with 4, so I did not consider vertical lines.
Interesting work though!
- Mark as New
- Bookmark
- Subscribe
- Mute
- Subscribe to RSS Feed
- Permalink
- Notify Moderator
Gabriel's problem statement said that point 5 was to be constrained to the 4 - 5 line and the problem terminated when point 5 coincided with 4, so I did not consider vertical lines.
Yes, but he had two points numbered 5 in his explanations and its not really clear to me what the final job will. Reading his very first post again it looks like he want to make the figure dependable on the length 01 and an angle beta (at one of his points 5)??
But you are right, whatever interpretation of the problem, it seems we won't have to cope with vertical lines. Anyway, I always try to make my routines as general as possible for better reuseability - problem being I won't find them when I am in need for it.
- Mark as New
- Bookmark
- Subscribe
- Mute
- Subscribe to RSS Feed
- Permalink
- Notify Moderator
For whatever it may be worth, here is a much more compact version of the intersect() routine. One of those "why didn't I thought of that before" things.
- Mark as New
- Bookmark
- Subscribe
- Mute
- Subscribe to RSS Feed
- Permalink
- Notify Moderator
Its not fully clear from your description - do you want the line 45 run through the point (L/0) or do you want that the angle 054 at the variable point 5 to be a given value beta?
I guess its the first scenario and L should be the sum of L1 to L4 (divided by x.scale) and the angle at point 5 will vary.
In the second case point 5 would move on a circle and L.4 would be obsolete, so I guess this is not what you are supposed to do.
- Mark as New
- Bookmark
- Subscribe
- Mute
- Subscribe to RSS Feed
- Permalink
- Notify Moderator
Yes Werner, is the first scenario, apologize for not being clear enough. Thank you!
- Mark as New
- Bookmark
- Subscribe
- Mute
- Subscribe to RSS Feed
- Permalink
- Notify Moderator
So we may assume the question is answered now?
- Mark as New
- Bookmark
- Subscribe
- Mute
- Subscribe to RSS Feed
- Permalink
- Notify Moderator
Dear Werner,
Have you produced the animation using mathcad or you have recorded it using another software? I found the answer. How important are for you gentlemen the points for a correct answer?
regards,
Gabriel
- Mark as New
- Bookmark
- Subscribe
- Mute
- Subscribe to RSS Feed
- Permalink
- Notify Moderator
GABRIEL SAS wrote:
Dear Werner,
Have you produced the animation using mathcad or you have recorded it using another software? I found the answer. How important are for you gentlemen the points for a correct answer?
regards,
Gabriel
I won't care for those points, but
1) you should let us know if the supplied sheets solved you problem or at least helped.
and
2) if the problem is solved, the question should be flagged as answered, either by clicking "assume answered" or by selecting one post to be the correct answer. This fulfills two purposes, People hanging out here to help would know that no further help is needed here and if sometimes later someone comes here because he searches for a similar problem he can be pointed to the correct answer without wading through the full thread.
BTW, whats that background of this problem. What does this figure represent?
- Mark as New
- Bookmark
- Subscribe
- Mute
- Subscribe to RSS Feed
- Permalink
- Notify Moderator
The background is stability of gravity dams. I'm looking into showing to students how different parameters are influencing the sliding and overturning stability of dams. Most of them use matchad for calculations so I have to adapt also. I will continue the worksheet because it will be of good help in correcting quickly assignments, perhaps I will need some further assistance. When it will be finished I will make it available to this comunity.
- Mark as New
- Bookmark
- Subscribe
- Mute
- Subscribe to RSS Feed
- Permalink
- Notify Moderator
Dear all,
I have a follow-up question for the problem discussed above. I would like to represent the variation of the uplift pressure (trapezoid) as a function of the line defined by the points (0,0) and P5(alfa). The red trapezoid represents the initial location, the magenta the position as alfa is increased. Point P5(alfa) stays on the black like, as previously discussed, for alfa=0 to the point where coordinates of points 4 and 5 are identical. The width pw is constant up to 3/4 of B (alfa) length and then decreased to 0 when B(alfa) is full.
Thank you
- Mark as New
- Bookmark
- Subscribe
- Mute
- Subscribe to RSS Feed
- Permalink
- Notify Moderator
You have the length of B(alpha) already. The area is then (7/8)*pw*B(alpha).
- Mark as New
- Bookmark
- Subscribe
- Mute
- Subscribe to RSS Feed
- Permalink
- Notify Moderator
I realized that, but I'm looking into defining the points of the area so I can calculate the center of gravity also.
Did not pay attention to my worksheet. Problem solved.
- Mark as New
- Bookmark
- Subscribe
- Mute
- Subscribe to RSS Feed
- Permalink
- Notify Moderator
I tried to replicate Werner's calculations for the section "coordinates of the uplift pressure-3/4 rectangular+1/4 triangular" without success. I verify the results with some cases for alfa= 0,10, 20 and -20 deg in autocad. If I verify individually for each alfa the results are correct. However, when I generate the results in the table at the end the values of the gravity centers are not correct. Clearly I'm missing something and I don't know what.
- Mark as New
- Bookmark
- Subscribe
- Mute
- Subscribe to RSS Feed
- Permalink
- Notify Moderator
I have absolutely no idea what you are trying to do her and what geometrical figure you are dealing with. But the fact, that the table at the end correspond to the Autocad values for -20° only may be due to the fact, that your definition of X.U.2 and Y.U.2 use exactly those -20° which is defined above the "Animation" section and this value is a constant, you didn't made it variable.
- Mark as New
- Bookmark
- Subscribe
- Mute
- Subscribe to RSS Feed
- Permalink
- Notify Moderator
Sorry for not being clear enough. I'm trying to calculate the area and center of gravity of the blue trapezoid in the last graph. These properties are also dependent on the variable point P5(alfa). I attached a figure for clarity. The red contour is the initial position, the magenta is the final position.
I'm not quite sure if the -20° is just a coincidence. The areas are identical to those from autocad for angles of 0, 10, 20.
Now I realized what you meant Werner,
Basically my question is how can I add the coordinates of P5(alfa), in X.U.2 and Y.U.2 for every increment of alfa angle.
Thanks for helping.
- Mark as New
- Bookmark
- Subscribe
- Mute
- Subscribe to RSS Feed
- Permalink
- Notify Moderator
Your definition of X.U.2 and Y.U.2 are based on P5.G(-20°) - always! No matter what angle alpha you later provide as argument in your functions. If this is on purpose my best guess is that you constructed the blue figure differently than in Autocad.
EDIT: The points you create do in no way correspond to the sketch you provided. I assume there are some 90° angles which are not denoted in the sketch. I am surprised as you wrote that the areas calculated are correct. As I interprete the sketch they shoulould differ by a factor of cos(alpha). For example the fourth point in the data you create is always straight down at (0/-pw). The sketch shows that point on a line which is 90° to the slope P0-P5.
- Mark as New
- Bookmark
- Subscribe
- Mute
- Subscribe to RSS Feed
- Permalink
- Notify Moderator
Some more comments and findings:
1) Upon looking closer at the values I cannot spot any differences between the values in the table and the values from your Autocad verification!!?? Where do you think are the values not same? It looks to me they are the same, at least up to the second decimal.
2) I notice that in your Autocad verification the lower Y value of the bounding box is -5.5 for all angles. This means you have designed the lower figure the same way as in the Mathcad sheet - point 3 in your list is always straight down. And as I have already written this in no way does not corrspond with the drawing you sent. Also it does not correspond with the title of the section where you name it "3/4 rectangular". This would be true in your drawing, but the way you created the points its a rectangle (+triangle) only for alpha=0, otherwise its just a parallelogram with no right angle!
3) According to the drawing, p.w should be only araound 2.2 (half the base at alpha=0) and not 5.5
4) The angle beta a the rightmost point is not exactly 65° as in your drawing but slightly larger (65,653°). Should it be exactly 65°? Then base point 5 at the beginning must not be given but calculated.
- Mark as New
- Bookmark
- Subscribe
- Mute
- Subscribe to RSS Feed
- Permalink
- Notify Moderator
Thank you Werner for looking closer to my problem. I truly appreciate it. My time and my skills dedicated to this worksheet are limited so clearly I did mistakes.
On your points from your previous comment:
1)+2) My AutoCad verification is clearly wrong. I have used as input value the vectors I defined the worksheet. This is the reason why are the same.
3) The sketch is generic. pw is the water pressure rho*g*Hw. All of them are constants. Here I defined pw as 5.5=Hw
4) Angle beta is also constant. I did not want to load the cad figure with too much text. beta should be the one calculated in worksheet: 65,653.
I have redrawn the trapezoid correctly in AutoCad for verification. I inserted in the worksheet attached.
Points 0,5,8,10 represent the coordinates of the uplift pressure (the area Area_U2(alfa) in my worksheet) which has the shape of trapezoid with the small base 3/4B(large base) B is line 05.
The entire trapezoid should rotate according to the rotation of line 05. Please help me to determine the area and center of mass of this trapezoid?
My guess is that I have to work with local variables for the points defining the trapezoid, but I have no experience in using this method.
Thank you.
- Mark as New
- Bookmark
- Subscribe
- Mute
- Subscribe to RSS Feed
- Permalink
- Notify Moderator
OK, I made two animation of the situation as I understand it.
UpliftAni_GS is using your definition of the lower polygon and UpliftAni_WE is using what I thought it should be according to the drawing. Given your new Autocad sketches it seems that my interpretationm was correct. Nevertheless only the values for -20° and 0° match while the other two slightly differ. Any explanation? Maybe you try to compare other angles, too.
- Mark as New
- Bookmark
- Subscribe
- Mute
- Subscribe to RSS Feed
- Permalink
- Notify Moderator
Yes you interpretation was correct Werner. Honestly I don't know why is the difference between the values for 10 and 20 degrees, I will check with other angles also.In the meantime I derived the points of bottom trapezoid. I guess I'm on the right track (?). I'm under alot of time pressure, I was suppose to finish this worksheet yesterday, sorry for asking for so much help.


