Community Tip - Learn all about the Community Ranking System, a fun gamification element of the PTC Community. X
- Subscribe to RSS Feed
- Mark Topic as New
- Mark Topic as Read
- Float this Topic for Current User
- Bookmark
- Subscribe
- Mute
- Printer Friendly Page
Is it possible to interpolate the scattered data in 2D?
- Mark as New
- Bookmark
- Subscribe
- Mute
- Subscribe to RSS Feed
- Permalink
- Notify Moderator
Is it possible to interpolate the scattered data in 2D?
Hi All,
I am new to this community. Forgive me if my question has been answered somewhere.
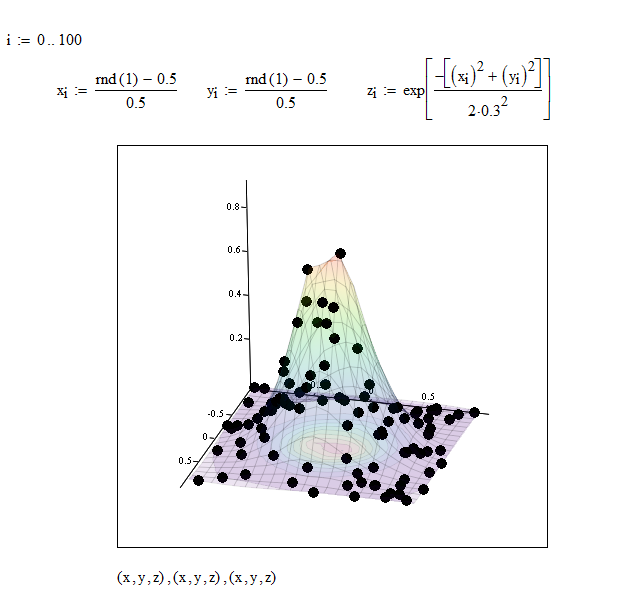
I have a 2D data set, but the sampling points are not on the regular Cartesian grid.I would like to rearrange the sampling point by interpolation and generate a new table with Cartesian grid.It looks MatLAB or IDL guys use a function called “griddata”.
However, when I make a surface plot or contour plot, MathCAD is interpolating the scattered data and making Cartesian data set. So the MathCAD already have something equivalent to griddata.
I am wondering if someone know MathCAD function or routine which does something equivalent to griddata.
Solved! Go to Solution.
- Labels:
-
Statistics_Analysis
Accepted Solutions
- Mark as New
- Bookmark
- Subscribe
- Mute
- Subscribe to RSS Feed
- Permalink
- Notify Moderator
Nobuhiko IZUMI wrote:
Hi All,
This morning I learned about multivariate fitting functions of MathCad 15.
I found a couple of interesting functions in the E-book of the DAEP.
The first one is multivariate fitting by regress.
The second one is multivariate fitting by loess.
They both worked fine when the number of data points is more than 100.
However, when the number of data points is less than 50, those methods are not stable and the calculations do not converge to a solution.
It looks loess function is not stable when the number of data points are more than 800.
The interpolation algorithm used in the 2D surface plot looks much better than those two functions.
It would be nice if we can use the algorithm used in the 2D surface plot.
Possibly the problem is partly that of appearance. If you set the number of grid points in your regression to 21, rather than 20, then the surfaces are a good match. The match doesn't appear to be too bad numerically. You also need to ensure that you have chosen a valid polynomial order for the regression; order 10 requires 11^2 points to obtain a fit.
I've attached a worksheet giving a rather crude form of griddata (data,p,q), as a demonstration of the principle of creating such a function. I haven't done anything other than give it a rudimentary check for accuracy or subject it to any statistical analysis. Nor does it have a particularly clever algorithm for choosing the upper and lower limits of the grid when the input arguments p and q give the number of x and y axis gridpoints rather than specifying the gridpoints in the corresponding axis.
Stuart
- Mark as New
- Bookmark
- Subscribe
- Mute
- Subscribe to RSS Feed
- Permalink
- Notify Moderator
Hi All,
This morning I learned about multivariate fitting functions of MathCad 15.
I found a couple of interesting functions in the E-book of the DAEP.
The first one is multivariate fitting by regress.
The second one is multivariate fitting by loess.
They both worked fine when the number of data points is more than 100.
However, when the number of data points is less than 50, those methods are not stable and the calculations do not converge to a solution.
It looks loess function is not stable when the number of data points are more than 800.
The interpolation algorithm used in the 2D surface plot looks much better than those two functions.
It would be nice if we can use the algorithm used in the 2D surface plot.

- Mark as New
- Bookmark
- Subscribe
- Mute
- Subscribe to RSS Feed
- Permalink
- Notify Moderator
As a general point, you need many more points to estimate the position and shape of a 2d object (surface) compared to a 1d 'histogram'. In 3d (estimating volume density) it's even worse.
If one needs 30 points to 'fit' a Gaussian to a histogram (and decide if it is a Gaussian), then you'll need 1000 points for 2d and 30,000 points in 3d. It's called the "curse of dimensionality", and is why there has been a major change in estimation methods for 'Big Data' (because there isn't enough data for all the dimensions needed! 😉 to use Support Vector Machines and kernel methods, and many more (digression ends..)
If all you want to do is determine the 'centre' (x,y) and radius (sigma) of a 2d Gaussian then it can be done with fewer points, because you have limited yourself to three unknowns, but that's not the same as the visualisation issue.
You can simply plot every point as a 3d scatter plot, once you get the invocation right, but that's not a 'fit'. Fitting would be easy if it wan't for Human unintelligence (cf artificial Intelligence)
- Mark as New
- Bookmark
- Subscribe
- Mute
- Subscribe to RSS Feed
- Permalink
- Notify Moderator
Thank you Philip,
I see it is important to know the statistical behavior of the system.
The maximum spatial frequency we can extract is also affected by the number of data points.
I will do some try and error to find reasonable data point density for the problem.
problem.
Niko IZUMI
- Mark as New
- Bookmark
- Subscribe
- Mute
- Subscribe to RSS Feed
- Permalink
- Notify Moderator
Nobuhiko IZUMI wrote:
Hi All,
This morning I learned about multivariate fitting functions of MathCad 15.
I found a couple of interesting functions in the E-book of the DAEP.
The first one is multivariate fitting by regress.
The second one is multivariate fitting by loess.
They both worked fine when the number of data points is more than 100.
However, when the number of data points is less than 50, those methods are not stable and the calculations do not converge to a solution.
It looks loess function is not stable when the number of data points are more than 800.
The interpolation algorithm used in the 2D surface plot looks much better than those two functions.
It would be nice if we can use the algorithm used in the 2D surface plot.
Possibly the problem is partly that of appearance. If you set the number of grid points in your regression to 21, rather than 20, then the surfaces are a good match. The match doesn't appear to be too bad numerically. You also need to ensure that you have chosen a valid polynomial order for the regression; order 10 requires 11^2 points to obtain a fit.
I've attached a worksheet giving a rather crude form of griddata (data,p,q), as a demonstration of the principle of creating such a function. I haven't done anything other than give it a rudimentary check for accuracy or subject it to any statistical analysis. Nor does it have a particularly clever algorithm for choosing the upper and lower limits of the grid when the input arguments p and q give the number of x and y axis gridpoints rather than specifying the gridpoints in the corresponding axis.
Stuart
- Mark as New
- Bookmark
- Subscribe
- Mute
- Subscribe to RSS Feed
- Permalink
- Notify Moderator
Thank you Stuart,
The file you attached is very instructive. It includes a lot of techniques I
didn't know about. I didn't know the fact that it is possible to define
functions inside a MathCAD program. It is a good idea to determine the order of
regression by checking the length of the data array. I will go through your
file step by step and learn from it.
Thank you very much for your instructive suggestions.
Niko IZUMI
- Mark as New
- Bookmark
- Subscribe
- Mute
- Subscribe to RSS Feed
- Permalink
- Notify Moderator
Nobuhiko IZUMI wrote:
However, when I make a surface plot or contour plot, MathCAD is interpolating the scattered data and making Cartesian data set. So the MathCAD already have something equivalent to griddata.
Whilst the algorithm is contained within the Mathcad application by virtue of being part of the Mathcad 3D plot component, it does not actually form part of Mathcad itself. The 3D plot component is based upon OpenGL and makes internal use only of OpenGL's surface plot functions. These functions are not exposed to the rest of Mathcad, nor does it appear possible to return the generated data from the 3D Plot (there have been a couple of requests to enhance the 3D Plot, and specifically to return the grid data).
Stuart
- Mark as New
- Bookmark
- Subscribe
- Mute
- Subscribe to RSS Feed
- Permalink
- Notify Moderator
HI Stuart,
It looks the internal algorithm based on OpenGL is reasonable and stable. I need to be careful because seemingly good fits and meaningful fits are different. It is exciting to learn things I didn't know.
Yesterday I was playing with griddata of IDL. It has many different algorithms and options. So I need to learn a lot and figure out which algorithm is good for my data. I will try to find relatively easy method which provides reasonable fit.
Thank you again!
Niko IZUMI
- Mark as New
- Bookmark
- Subscribe
- Mute
- Subscribe to RSS Feed
- Permalink
- Notify Moderator
This has come up enough times that I decided to bite the bullet, and write something that will interpolate scattered data to a regular grid. It uses local polynomial regression, but in a much more flexible way than loess. Depending on the number of points chosen for the local regression and the polynomial degree you can get either pure interpolation or some degree of smoothing.
- Mark as New
- Bookmark
- Subscribe
- Mute
- Subscribe to RSS Feed
- Permalink
- Notify Moderator
Richard Jackson wrote:
This has come up enough times that I decided to bite the bullet, and write something that will interpolate scattered data to a regular grid. It uses local polynomial regression, but in a much more flexible way than loess. Depending on the number of points chosen for the local regression and the polynomial degree you can get either pure interpolation or some degree of smoothing.
Neat Sheet, Richard. It fits the data better than my basic fit.
Stuart
- Mark as New
- Bookmark
- Subscribe
- Mute
- Subscribe to RSS Feed
- Permalink
- Notify Moderator
It fits the data better than my basic fit.
It does, but this data is easy to fit, so it's kind of hard to tell. Since it's based on polynomial regression it won't work so well for data with large flat areas or sudden changes in slope.
- Mark as New
- Bookmark
- Subscribe
- Mute
- Subscribe to RSS Feed
- Permalink
- Notify Moderator
Thank you Richard,
Now I am playing with your sheet. It is really neat.
Now I understand it is good to have control of the distance we care. When we know the surface has smooth transition within the small area, the transition inside the distance should be expressed by low order polynomial. Or, we need to design experiments to have enough points in that area. The sheet also includes a lot of techniques I have never tried. I will go through the sheet step by step and learn.
Thank you very much!!
- Mark as New
- Bookmark
- Subscribe
- Mute
- Subscribe to RSS Feed
- Permalink
- Notify Moderator
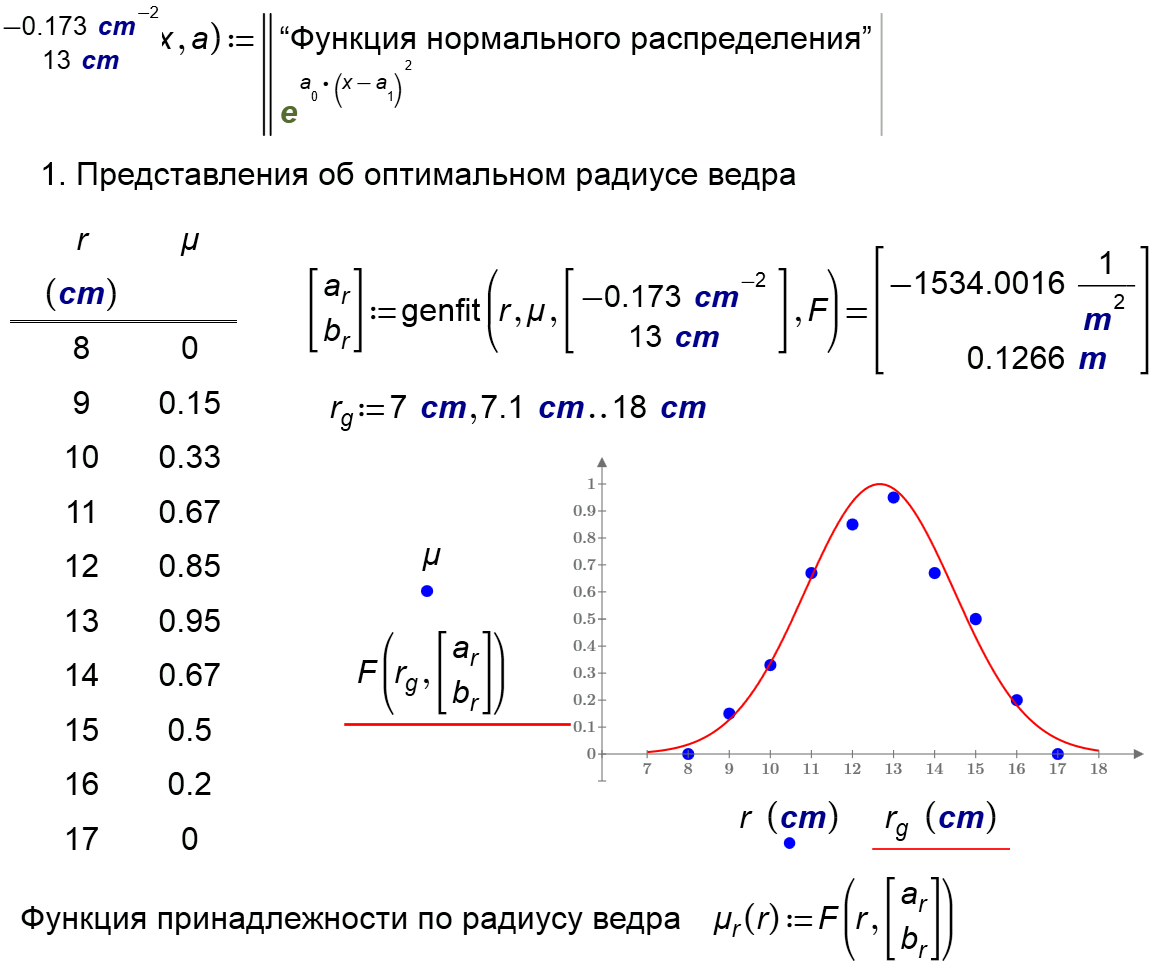
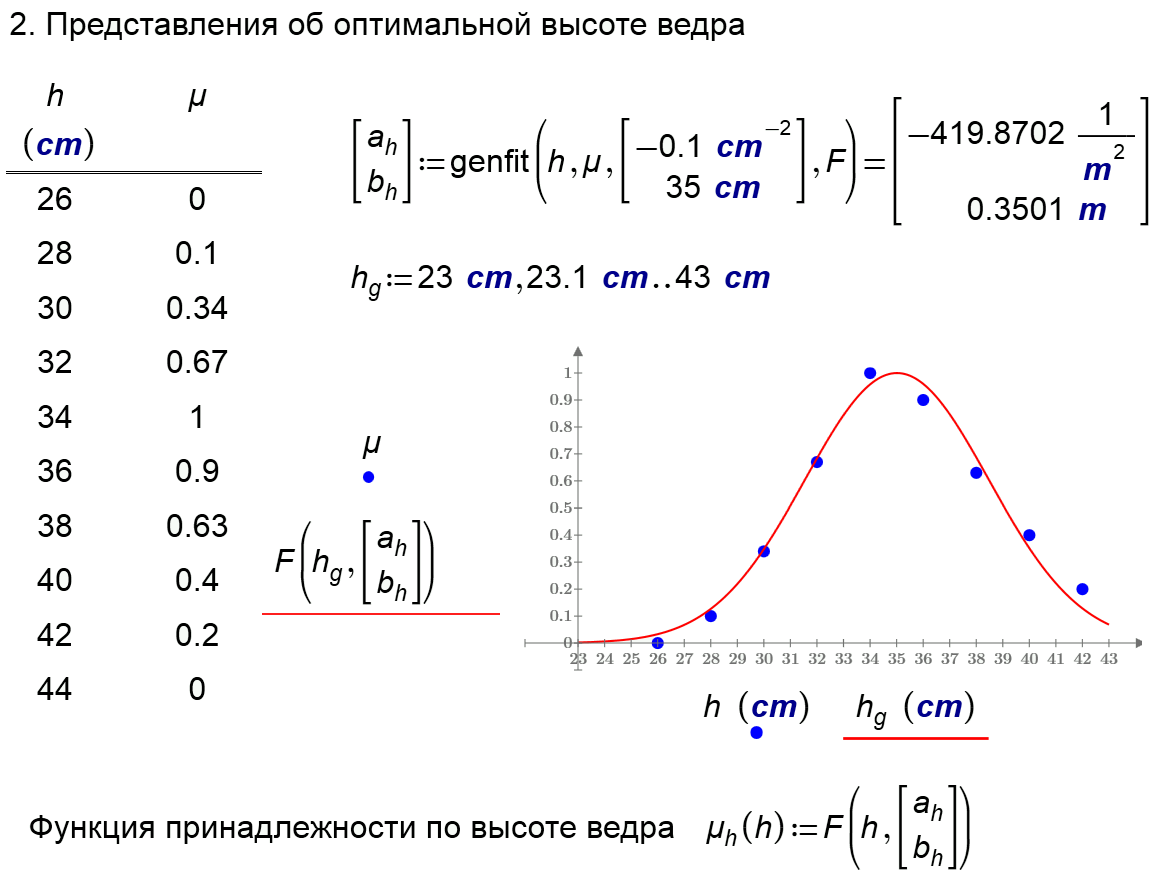
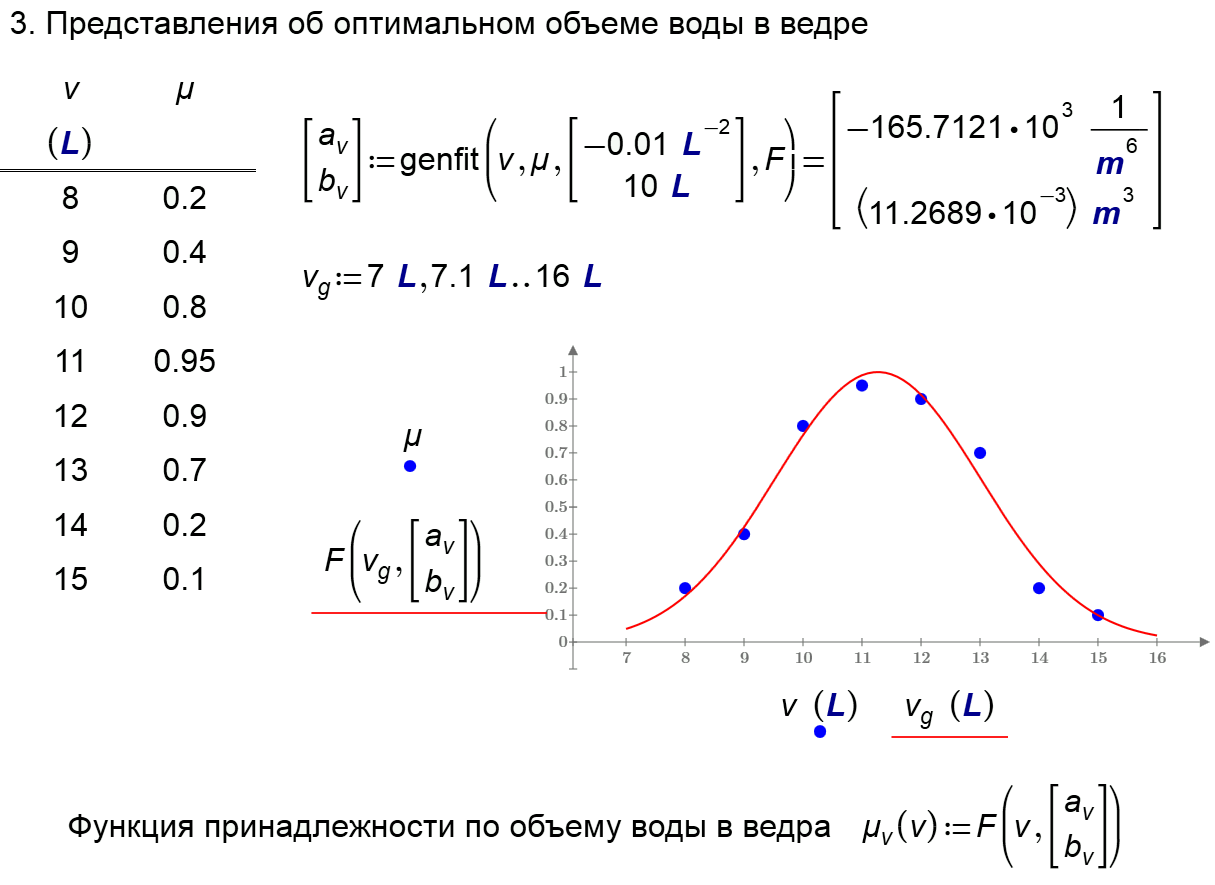
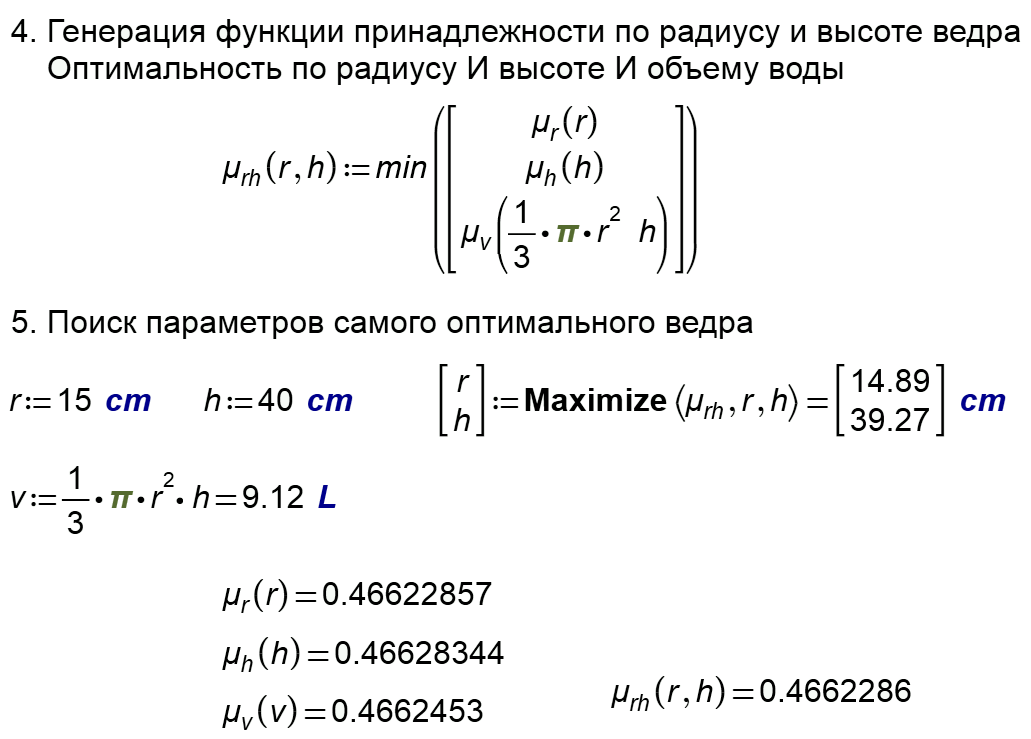
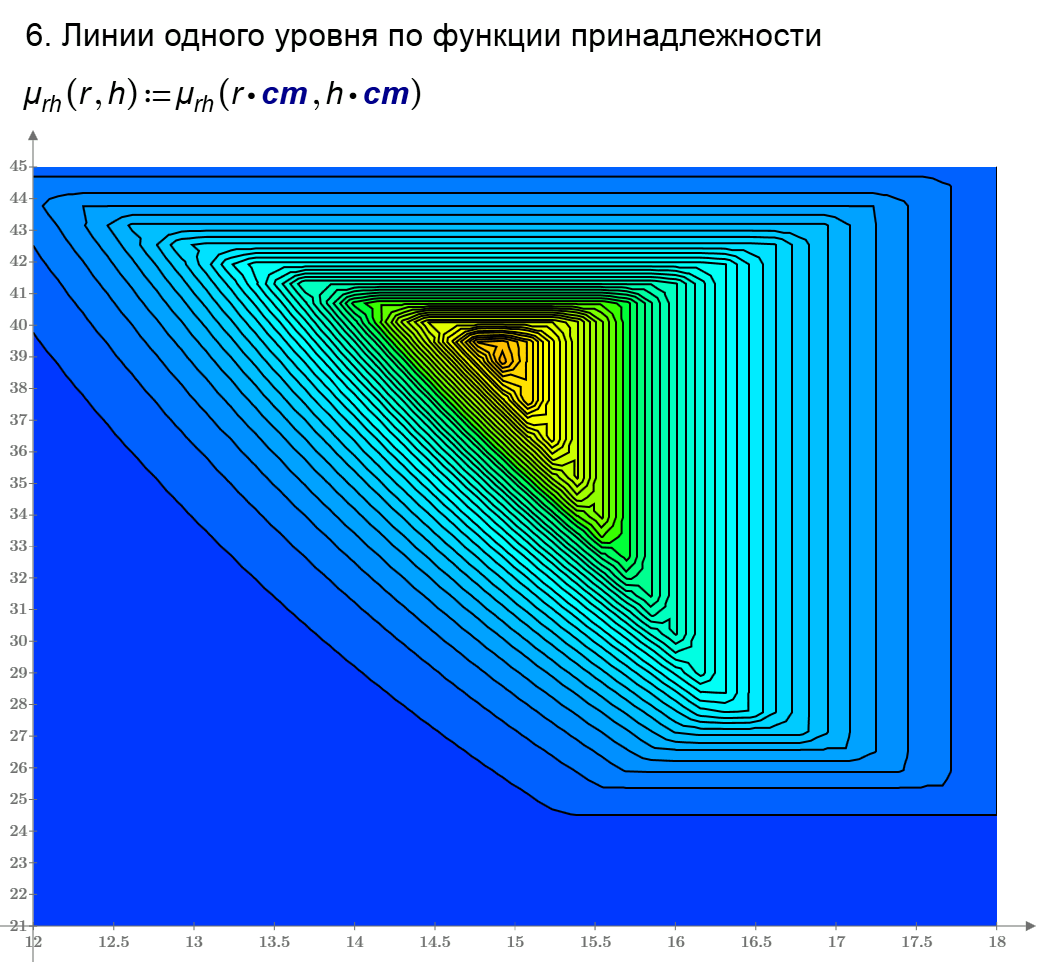
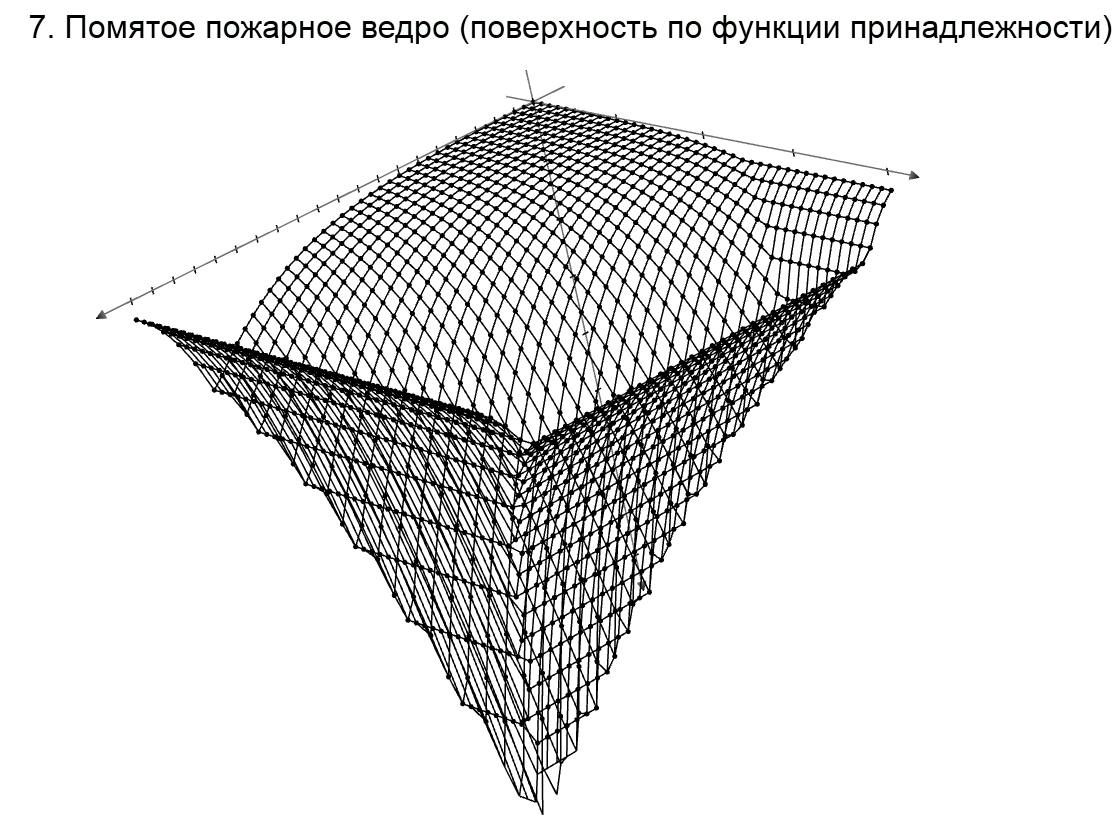
I have a problem with same pictures
- Mark as New
- Bookmark
- Subscribe
- Mute
- Subscribe to RSS Feed
- Permalink
- Notify Moderator
Hi Valery,
Yes, sometimes it is a good idea to run different algorithms and pick one which has a minimum chi - square.
I will try the functions you use and learn how they behave on my problem.
Thank you very much for the sheet.
Nobuhiko IZUMI
- Mark as New
- Bookmark
- Subscribe
- Mute
- Subscribe to RSS Feed
- Permalink
- Notify Moderator
Nobuhiko IZUMI wrote:
Hi Valery,
Yes, sometimes it is a good idea to run different algorithms and pick one which has a minimum chi - square.
I will try the functions you use and learn how they behave on my problem.
Thank you very much for the sheet.
Nobuhiko IZUMI
I am glad to help you.
See please the Mathcad Prime 3 file in attach


