Community Tip - When posting, your subject should be specific and summarize your question. Here are some additional tips on asking a great question. X
- Subscribe to RSS Feed
- Mark Topic as New
- Mark Topic as Read
- Float this Topic for Current User
- Bookmark
- Subscribe
- Mute
- Printer Friendly Page
Kinetic model of CSTR
- Mark as New
- Bookmark
- Subscribe
- Mute
- Subscribe to RSS Feed
- Permalink
- Notify Moderator
Kinetic model of CSTR
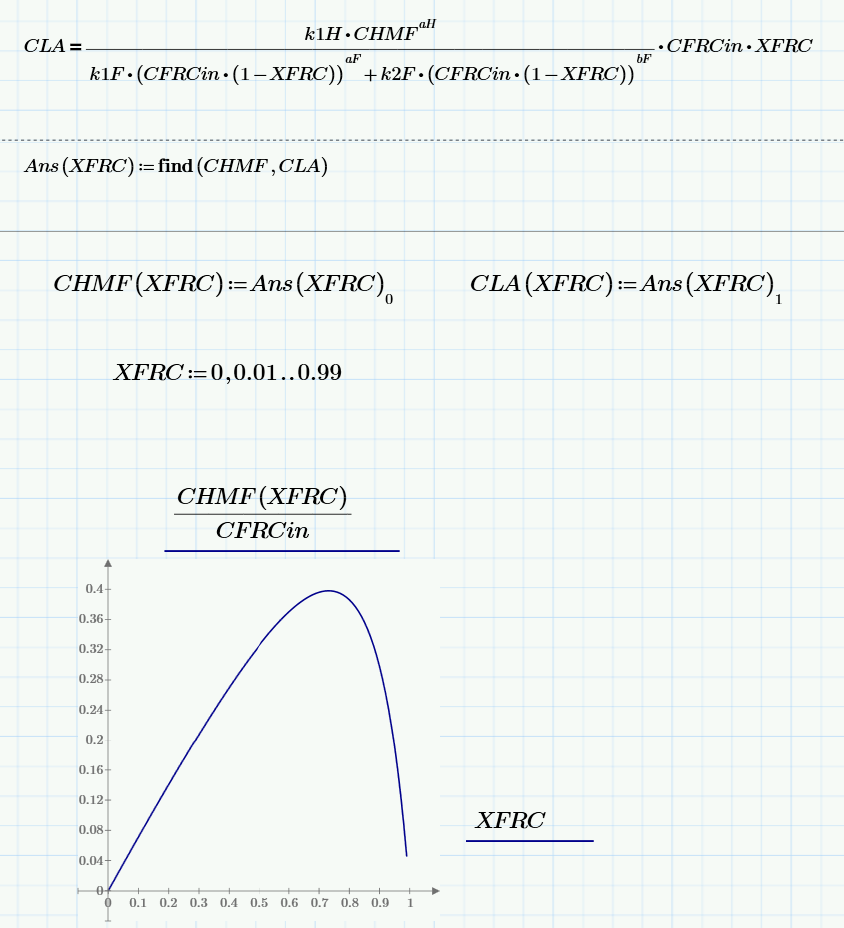
Hi, I'm new on the forum and inexperienced with Mathcad Prime 3, so I need help. In the attached sheet I just wrote the kinetic model for a CSTR, which is a simple system of
2 algebric equations. There are lots of parameters that are fixed and one, XFRC (conversione of the reagent), that must change because I have to plot the solution of the system
with respect to that parameter. How can I do that? Thanks and sorry if my english is not perfect ![]()
Solved! Go to Solution.
- Labels:
-
Other
Accepted Solutions
- Mark as New
- Bookmark
- Subscribe
- Mute
- Subscribe to RSS Feed
- Permalink
- Notify Moderator
- Mark as New
- Bookmark
- Subscribe
- Mute
- Subscribe to RSS Feed
- Permalink
- Notify Moderator
You apparently are using 3.1
Many of us , stuck at 3.0, cannot read your file.
- Mark as New
- Bookmark
- Subscribe
- Mute
- Subscribe to RSS Feed
- Permalink
- Notify Moderator
Please post PDF or XPS version of your Mathcad Prime worksheet.
- Mark as New
- Bookmark
- Subscribe
- Mute
- Subscribe to RSS Feed
- Permalink
- Notify Moderator
- Mark as New
- Bookmark
- Subscribe
- Mute
- Subscribe to RSS Feed
- Permalink
- Notify Moderator
Thanks, this is perfect! By the way this is a part of a study about kinetic, maybe I'll ask for some more help later! Thanks again to all of you ![]()
- Mark as New
- Bookmark
- Subscribe
- Mute
- Subscribe to RSS Feed
- Permalink
- Notify Moderator
You welcome!
I am and will be glad to help you!
See please too
Chemical Kinetics with Mathcad and Maple | Viktor Korobov | Springer
and the site of the book
- Mark as New
- Bookmark
- Subscribe
- Mute
- Subscribe to RSS Feed
- Permalink
- Notify Moderator
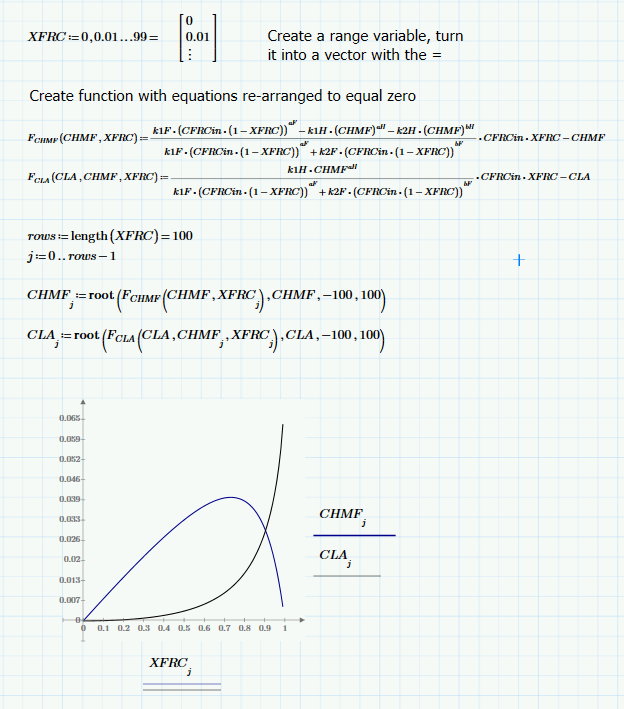
I think Valery's method is probably best. But here is an alternate version that gets rid of the solver. I think it works.
- Mark as New
- Bookmark
- Subscribe
- Mute
- Subscribe to RSS Feed
- Permalink
- Notify Moderator
Thank a lot to you too ![]() !!
!!
- Mark as New
- Bookmark
- Subscribe
- Mute
- Subscribe to RSS Feed
- Permalink
- Notify Moderator
- Mark as New
- Bookmark
- Subscribe
- Mute
- Subscribe to RSS Feed
- Permalink
- Notify Moderator
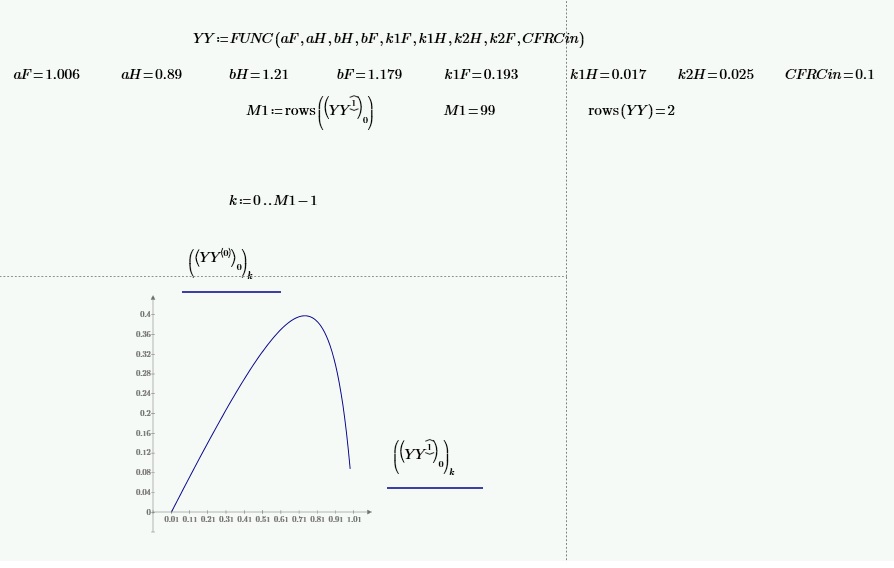
But better to have a function not a set of values!
- Mark as New
- Bookmark
- Subscribe
- Mute
- Subscribe to RSS Feed
- Permalink
- Notify Moderator
Hello again, my work proceeds but now I encountered another problem, related to my low programming skills. I am sure that you can solve it in a moment. In the image you can see a solve block for a single CSTR reactor, I need to iterate the soluzion for N CSTR reactors in series. This is banal on paper, because all you need to do is to use the solution of the first CSTR as input for the second and so on. So I tried to make a "for loop", but I found that solve blocks cannot go into programming area. How can I solve it?
P.S. of course the conversion XFRC will be referred to the entire series of reactors.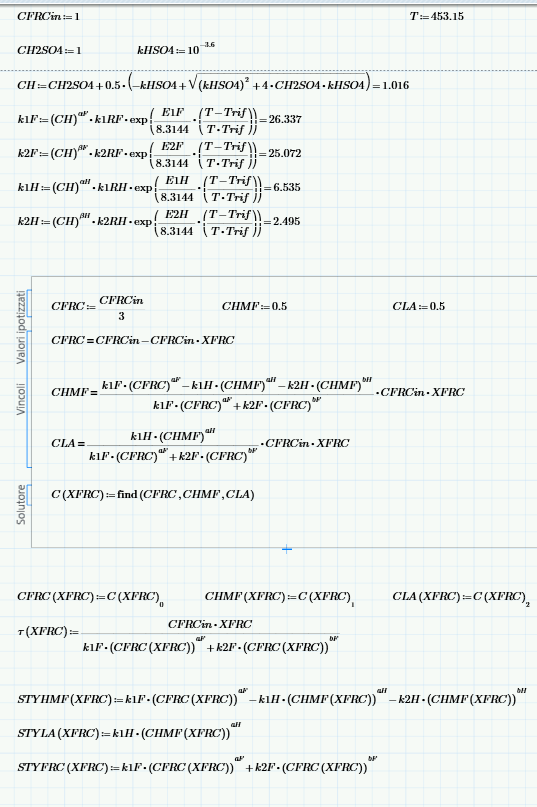
- Mark as New
- Bookmark
- Subscribe
- Mute
- Subscribe to RSS Feed
- Permalink
- Notify Moderator
You do not need to use the solve block inside a cycle - You need to use in the cycle a function created in the solve block.
- Mark as New
- Bookmark
- Subscribe
- Mute
- Subscribe to RSS Feed
- Permalink
- Notify Moderator
Another question - I hope this will be the last ![]() .
.
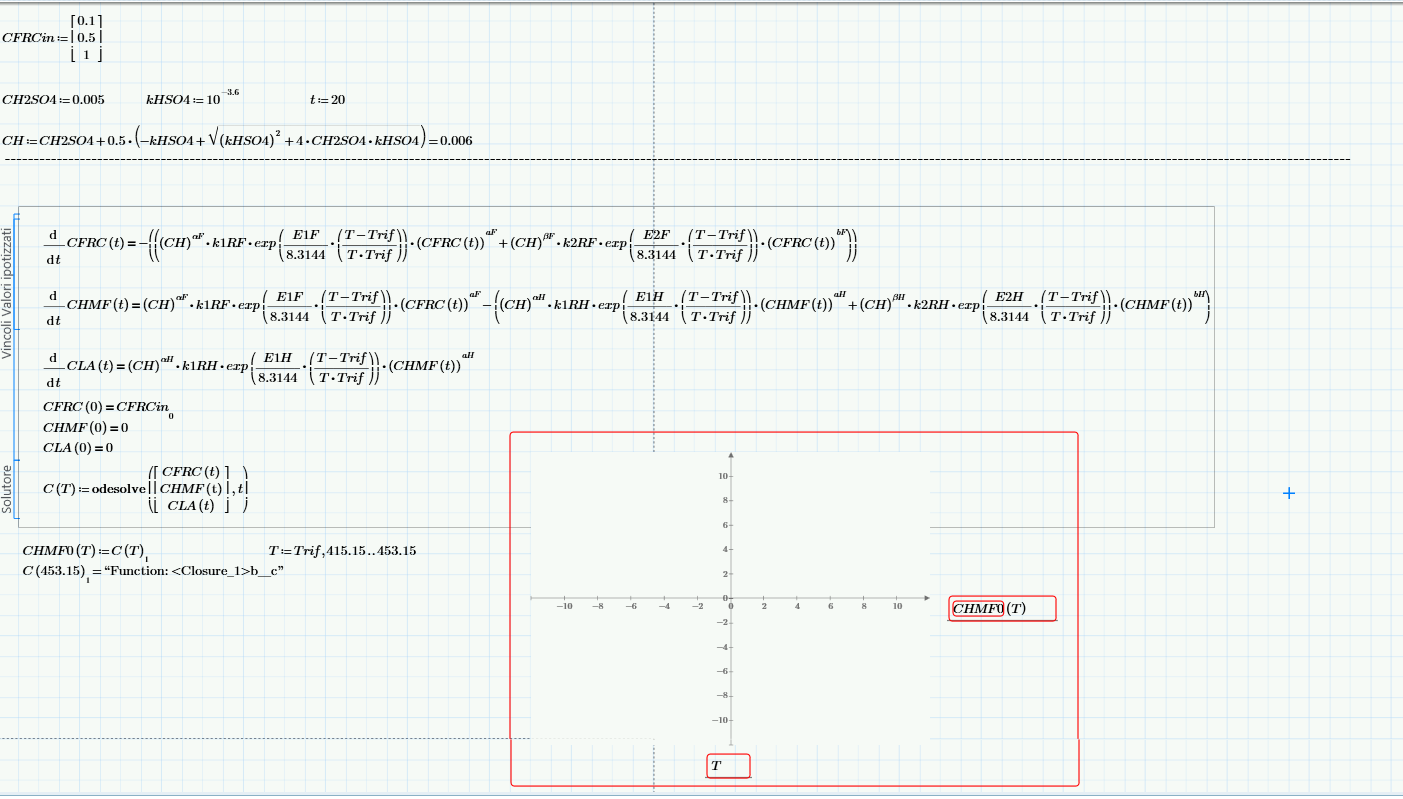
I need to graph the solution of the ode system vs temperature. I do not care about the trend vs time, I need only the output (after integration time) at various temperatures. How can I graph it? I'm probably wrong in assigning arguments of the function...
- Mark as New
- Bookmark
- Subscribe
- Mute
- Subscribe to RSS Feed
- Permalink
- Notify Moderator
Edit: I just solved using: CHMF0(T):=C(T)(t). I think this is ok for my purpose ![]()
- Mark as New
- Bookmark
- Subscribe
- Mute
- Subscribe to RSS Feed
- Permalink
- Notify Moderator
Send please the sheet.
- Mark as New
- Bookmark
- Subscribe
- Mute
- Subscribe to RSS Feed
- Permalink
- Notify Moderator
The sheet is in allegate, I have also a problem with a "cyclic dependency" error... thank you for your help!

