Community Tip - If community subscription notifications are filling up your inbox you can set up a daily digest and get all your notifications in a single email. X
- Subscribe to RSS Feed
- Mark Topic as New
- Mark Topic as Read
- Float this Topic for Current User
- Bookmark
- Subscribe
- Mute
- Printer Friendly Page
Labels in bar chart - Mathcad 15
- Mark as New
- Bookmark
- Subscribe
- Mute
- Subscribe to RSS Feed
- Permalink
- Notify Moderator
Labels in bar chart - Mathcad 15
Hi
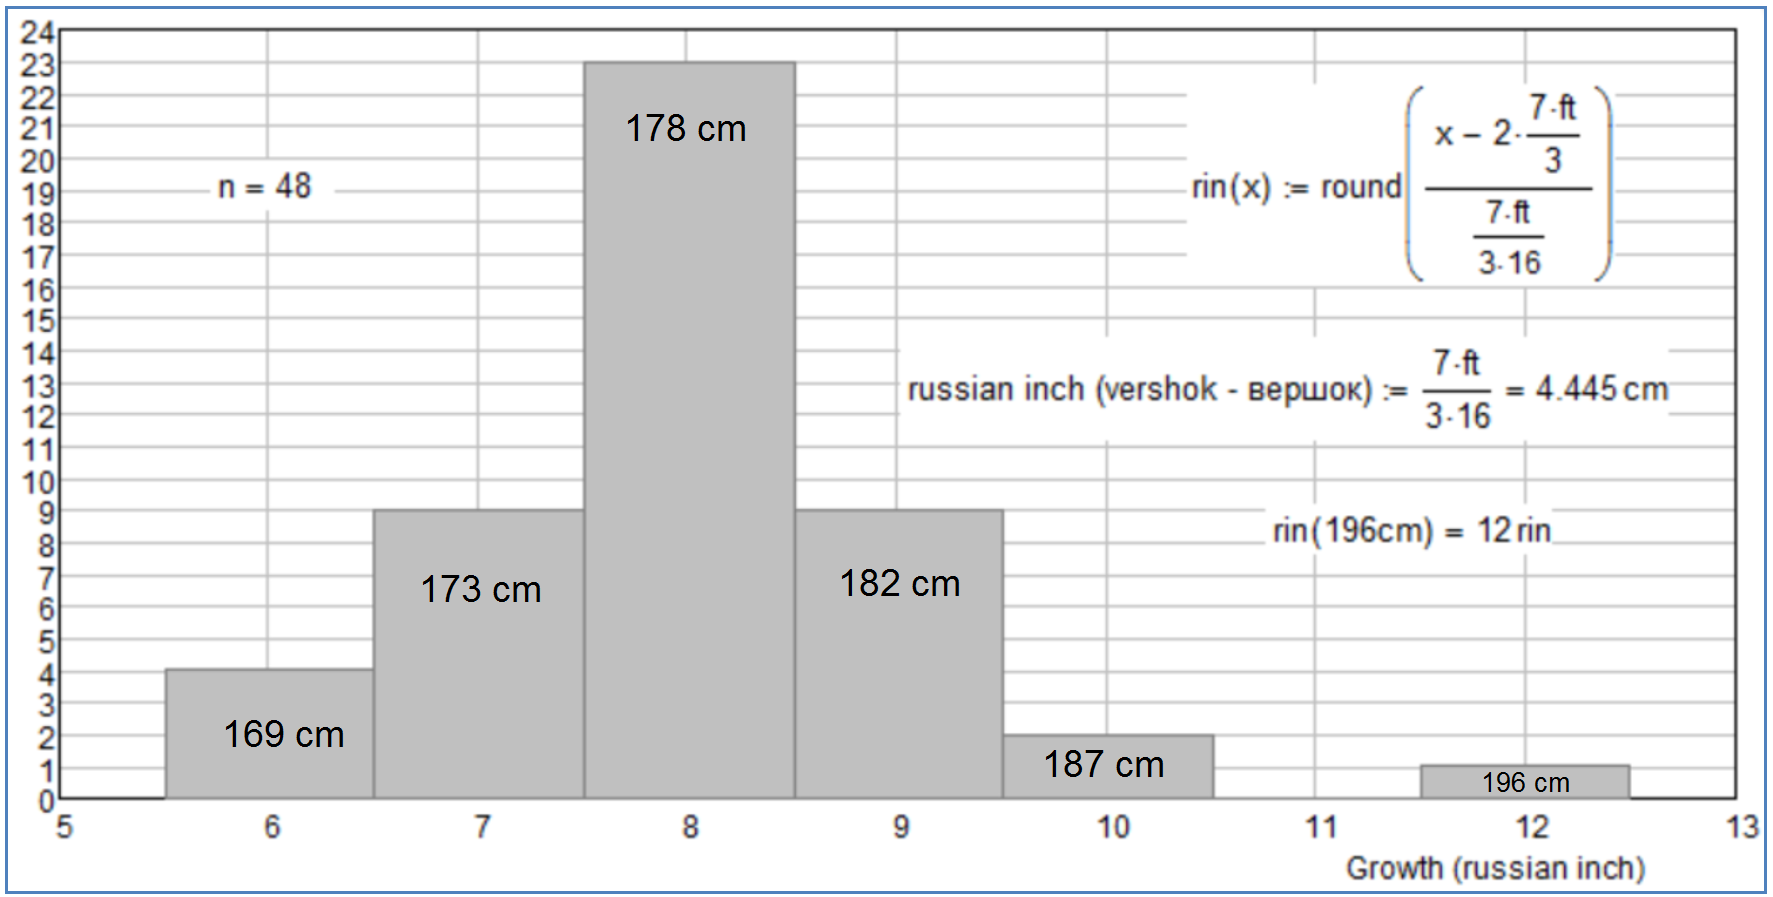
Is it possible to put "labels" below bars in a bar chart, to indicate what they represent? I believe I stumpled upon some kind of workaround some time ago, but I'm not able to find it again.
Thanks in advance
- Labels:
-
Other
- Mark as New
- Bookmark
- Subscribe
- Mute
- Subscribe to RSS Feed
- Permalink
- Notify Moderator
I do it manual

- Mark as New
- Bookmark
- Subscribe
- Mute
- Subscribe to RSS Feed
- Permalink
- Notify Moderator
Then I'd rather put the data in Excel and make the chart there.
- Mark as New
- Bookmark
- Subscribe
- Mute
- Subscribe to RSS Feed
- Permalink
- Notify Moderator
If you download and install this ebook: Creating Amazing Images with Mathcad 14, there are functions that will add text to a graph.
- Mark as New
- Bookmark
- Subscribe
- Mute
- Subscribe to RSS Feed
- Permalink
- Notify Moderator
Thanks for the link Richard. I've tried to implement it, but haven't been able to make it work. Don't know if it has something to do with the function using c and this being predefined as the speed of light. It's not a problem in the ebook, but seems maybe to be the problem, when I try to use it in my own project.
- Mark as New
- Bookmark
- Subscribe
- Mute
- Subscribe to RSS Feed
- Permalink
- Notify Moderator
That maybe a problem, but without seeing the worksheet it's impossible to say for sure. Try doing a find and replace, and replace c with cc in all the applicable functions.
- Mark as New
- Bookmark
- Subscribe
- Mute
- Subscribe to RSS Feed
- Permalink
- Notify Moderator
Please provide your worksheet with this problem.
- Mark as New
- Bookmark
- Subscribe
- Mute
- Subscribe to RSS Feed
- Permalink
- Notify Moderator
We can insert Excel-sheet in Mathcad


