- Subscribe to RSS Feed
- Mark Topic as New
- Mark Topic as Read
- Float this Topic for Current User
- Bookmark
- Subscribe
- Mute
- Printer Friendly Page
Log axis crossing
- Mark as New
- Bookmark
- Subscribe
- Mute
- Subscribe to RSS Feed
- Permalink
- Notify Moderator
Log axis crossing
I have a log-log plot. The y-axis range is 0.01 to 1.0. The problem is that the x-axis is labeled at the TOP of the y-axis.
Is there a way (as there is in EXCEL) to change where the x-axis labels are placed (i.e. - I want the labels to be at the lowest y value (on log scale) of 0.01)?
Solved! Go to Solution.
Accepted Solutions
- Mark as New
- Bookmark
- Subscribe
- Mute
- Subscribe to RSS Feed
- Permalink
- Notify Moderator
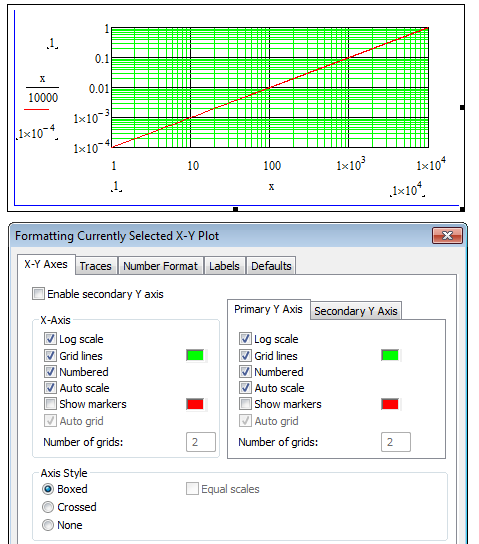
Double-click on the plot, select the "X-Y Axes" tab on the resulting dialog (should be the default tab anyway), then change the "Axis Style" at the bottom of the tab to "Boxed".
Stuart
- Mark as New
- Bookmark
- Subscribe
- Mute
- Subscribe to RSS Feed
- Permalink
- Notify Moderator
Which version of Mathcad are you using and could you post an example worksheet.
- Mark as New
- Bookmark
- Subscribe
- Mute
- Subscribe to RSS Feed
- Permalink
- Notify Moderator
version is Mathcad 15.0
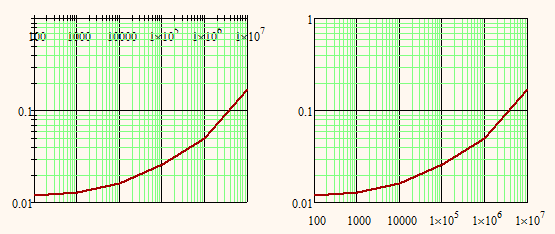
I don't know how to add the example, but this is the plot.
- Mark as New
- Bookmark
- Subscribe
- Mute
- Subscribe to RSS Feed
- Permalink
- Notify Moderator
Click u'se advanced editor' and then you will have the option to attach files.
- Mark as New
- Bookmark
- Subscribe
- Mute
- Subscribe to RSS Feed
- Permalink
- Notify Moderator
- Mark as New
- Bookmark
- Subscribe
- Mute
- Subscribe to RSS Feed
- Permalink
- Notify Moderator
- Mark as New
- Bookmark
- Subscribe
- Mute
- Subscribe to RSS Feed
- Permalink
- Notify Moderator
Thanks Mike. I preferred to keep log-log so changing y-axis to linear is 'last resort'.
StuartBruff gave me (07:22) instructions for log-log.
- Mark as New
- Bookmark
- Subscribe
- Mute
- Subscribe to RSS Feed
- Permalink
- Notify Moderator
Robert Martin wrote:
Thanks Mike. I preferred to keep log-log so changing y-axis to linear is 'last resort'.
StuartBruff gave me (07:22) instructions for log-log.
Good at least you have your answer. I only mentioned that option to show there was another option ![]()
- Mark as New
- Bookmark
- Subscribe
- Mute
- Subscribe to RSS Feed
- Permalink
- Notify Moderator
Double-click on the plot, select the "X-Y Axes" tab on the resulting dialog (should be the default tab anyway), then change the "Axis Style" at the bottom of the tab to "Boxed".
Stuart
- Mark as New
- Bookmark
- Subscribe
- Mute
- Subscribe to RSS Feed
- Permalink
- Notify Moderator

- Mark as New
- Bookmark
- Subscribe
- Mute
- Subscribe to RSS Feed
- Permalink
- Notify Moderator
I don't know why, but the choices for axis are boxed, crossed, and none.
On my version 15, I get your picture with crossed; with boxed the x axis is at the bottom.
- Mark as New
- Bookmark
- Subscribe
- Mute
- Subscribe to RSS Feed
- Permalink
- Notify Moderator
Removing the log scale from the Y-axis will also do the job.
- Mark as New
- Bookmark
- Subscribe
- Mute
- Subscribe to RSS Feed
- Permalink
- Notify Moderator
In Mathcad 15 (and below) there is unfortunately no way to change the point of intersection of the two axis.
This point will normally be (0/0) or (if zero is not in the range shown) the values closest to zero.
In case of a log plot the 0 is exchanged for 1 and the point of intersection tries to be at (1/1).
In case of your plot the intersection point is (100/1).
I guess you may like the view when you change Axis Style from Crossed to Boxed:


