cancel
Showing results for 
Search instead for 
Did you mean: 
cancel
Showing results for 
Search instead for 
Did you mean: 

Community Tip - If community subscription notifications are filling up your inbox you can set up a daily digest and get all your notifications in a single email. X

MC15 Box plot questions

dirving
1-Newbie

MC15 Box plot questions

Hello all,

Am trying to present my data in a box plot:

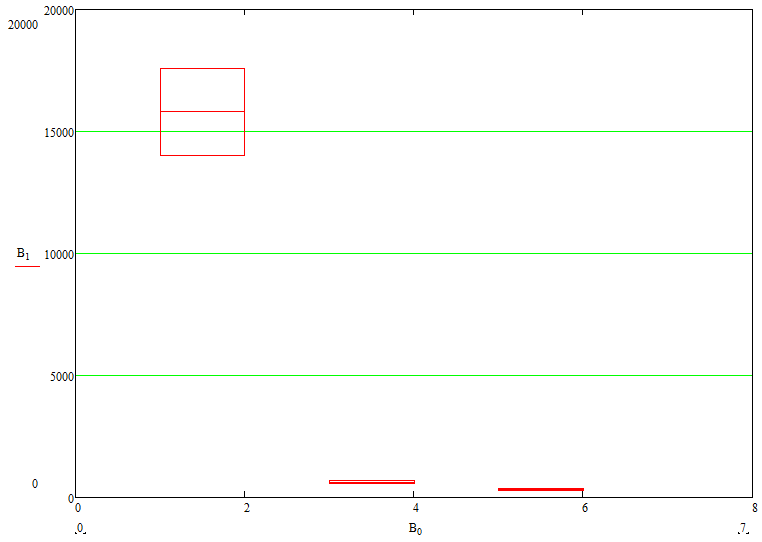
Is it possible to add a label to each of my boxes? Ideally under the X axis inline but anywhere on the graph would be fine. Looking at how it generates the plot I would think not but doesn't hurt to ask.

I would also like to change the y axis to a log scale but it's complaining that I have a non positive value in my dataset? Clearly from the data this shouldn't be the case.

Lastly is it possible to look into the code behind the "boxplotgraph()" function, and modify it to do something different?

3 REPLIES 3
RichardJ
19-Tanzanite
(To:dirving)

Is it possible to add a label to each of my boxes?

Yes, but only by using a function that creates text as another plot. Writing such a function would be a lot of work, but the e-book "Creating Amazing Images with Mathcad 14" fortunately has such functions. See here: https://www.ptcusercommunity.com/community/mathcad/mathcad-usage/blog/2010/05/27/creating-amazing-images-with-mathcad-14. You could copy the relevant functions (and the ones they depend on, of course) into a collapsible area in your worksheet.

I would also like to change the y axis to a log scale but it's complaining that I have a non positive value in my dataset? Clearly from the data this shouldn't be the case.

Zero is not a positive number, and, more specifically, log(0) is undefined.

Lastly is it possible to look into the code behind the "boxplotgraph()" function, and modify it to do something different?

No, but it probably wouldn't be that hard to create a function that plots boxes. How hard depends on exactly what you want to do.Depending on exactly what you want, it may even be possible to just augment the existing output of the boxplotgraph function. As an example of using functions to create a custom plot type (which of course is also what boxplotgraph does), I have attached a worksheet with functions that can be used to plot error bars on both the x and y axes.

StuartBruff
23-Emerald II
(To:dirving)

As Richard says, to put text at various positions you really can't do much better than to look at the Amazing Images eBook.

However, attached is an worksheet I knocked together for some reason or another about 10 years ago (that is a *scary* thought) to show how a boxplot *could* be implemented ...

Stuart

Changed the y axis to a non zero min value and the box plot now looks much better with a log y axis. Such a rookie mistake.

That's a fantastic eBook, thanks Gents!

Top Tags