
Turn on suggestions
Auto-suggest helps you quickly narrow down your search results by suggesting possible matches as you type.
Showing results for
Please log in to access translation
Turn on suggestions
Auto-suggest helps you quickly narrow down your search results by suggesting possible matches as you type.
Showing results for
Community Tip - You can change your system assigned username to something more personal in your community settings. X
Translate the entire conversation x
Please log in to access translation
Options
- Subscribe to RSS Feed
- Mark Topic as New
- Mark Topic as Read
- Float this Topic for Current User
- Bookmark
- Subscribe
- Mute
- Printer Friendly Page
Mathcad Prime 3.0 Plotting
Oct 23, 2013
04:30 PM
- Mark as New
- Bookmark
- Subscribe
- Mute
- Subscribe to RSS Feed
- Permalink
- Notify Moderator
Please log in to access translation
Oct 23, 2013
04:30 PM
Mathcad Prime 3.0 Plotting
I've used MathCad in the past for simple tasks but never for heavy graph plotting.
I have a MathCad Prime 3.0 sheet that have a set of equations that take inputs at the top of the sheet.
As it runs through each set of the equations it reaches the final equation which provides me with the single answer.
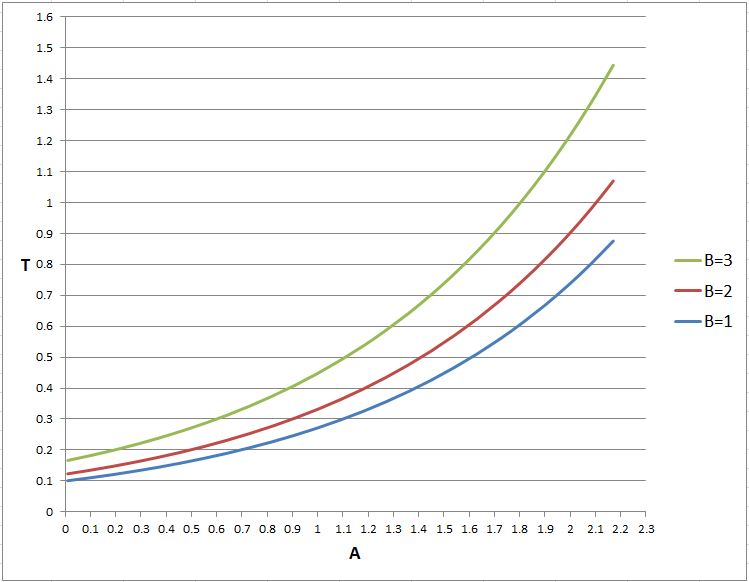
So in very simplistic fashion as shown here I have three known values that two are used in the first equation and the solution from the first is inputed to the final equation to give the answer T.
A=1
B=2
C=5
L=A^2+B^2
T=L*C
Now I want an XY plot graph that shows A on the X axis and T on the Y axis. And then show multiple lines depicted by the changing of B.
So the graph would have lines for each value chosen for B and plot each line with A changing and the output of T.
The sheet is just one set of equations for a single input and a single answer output.
Is there a way to take that and have the inputs varied and plot the outputs as described above.
What steps or functions on MathCad Prime 3.0 would I have to do to make this possible.
Here's an example of a graph I would hope to get. Thanks.
Labels:
- Labels:
-
Other
2 REPLIES 2
Oct 23, 2013
05:10 PM
- Mark as New
- Bookmark
- Subscribe
- Mute
- Subscribe to RSS Feed
- Permalink
- Notify Moderator
Please log in to access translation
Oct 23, 2013
05:10 PM
The graph you provided does not reflect the equations you have given.
Would something like the attached help?
Prime is an unfinished product and so plotting is only implemented rather rudimentary in Prime. Especially we lack a lot of formating options like grid lines, labels, legends, etc.
Oct 23, 2013
09:49 PM
- Mark as New
- Bookmark
- Subscribe
- Mute
- Subscribe to RSS Feed
- Permalink
- Notify Moderator
Please log in to access translation
Oct 23, 2013
09:49 PM
Your right the graph I posted doesn't the match the equations. It was just a quick example as was the equations.
The file you provided helped with adjusting the file I have to get what I needed. Thanks!


