Community Tip - You can Bookmark boards, posts or articles that you'd like to access again easily! X
- Subscribe to RSS Feed
- Mark Topic as New
- Mark Topic as Read
- Float this Topic for Current User
- Bookmark
- Subscribe
- Mute
- Printer Friendly Page
Mathcad help :(
- Mark as New
- Bookmark
- Subscribe
- Mute
- Subscribe to RSS Feed
- Permalink
- Notify Moderator
Mathcad help :(
Hello, my name is Alex and i am a student at the Polytechnic University of Bucharest.
I have never used this software before and it is getting very dificult finding what i need.
My industrial design teacher has given me some equation stuff to work, but i never used mathcad.
I have to create in mathcad 2 cylinders that would intersect and after that make some calculations.
The first is vertical and the second should passthrough the first but horizontaly, i've attached a photo, hope this will be usefull.
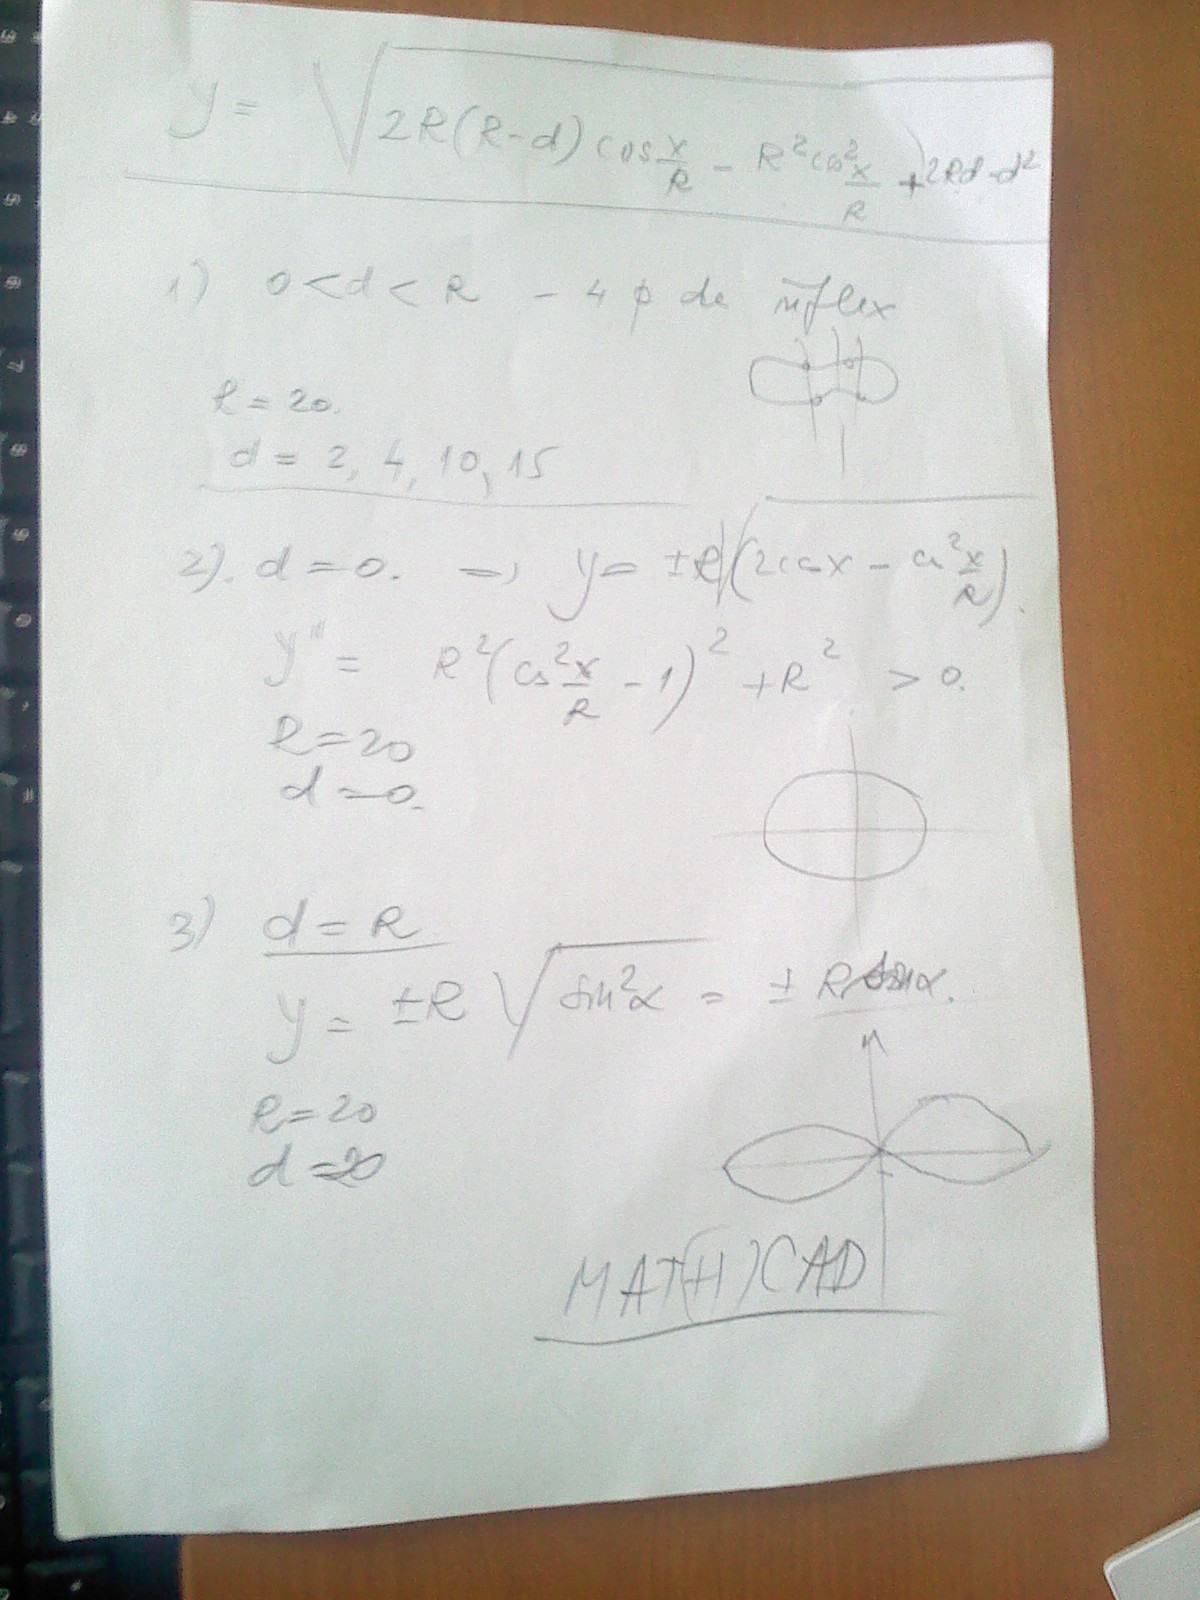
He explained me that there ar 3 scenarios i need to test, all based on assigning a diferent value to "d".
Please help if can ![]()
Solved! Go to Solution.
- Labels:
-
Other
Accepted Solutions
- Mark as New
- Bookmark
- Subscribe
- Mute
- Subscribe to RSS Feed
- Permalink
- Notify Moderator
I don't know what the real needs are, either.
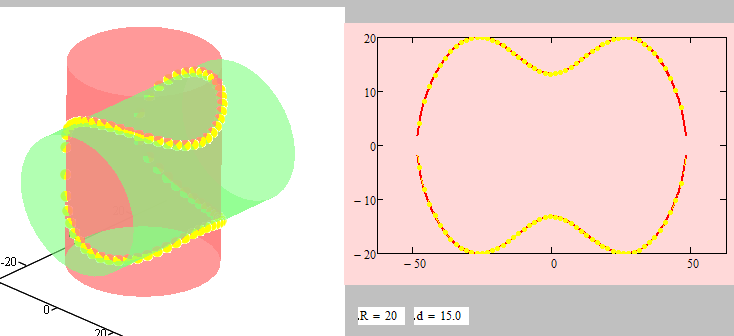
It looks to me as if the graph which is described is the flatprojection/unrolling of the intersection of two orthogonal cylinders of same size. d being some kind of offset. d=r meaning that the axis of the cyliniders intersect and the cylinder intersection collapsed into two ellipses which unroll to two sines. But then, i may be wrong - the formulas I came up with are slightly different from those posted.
- Mark as New
- Bookmark
- Subscribe
- Mute
- Subscribe to RSS Feed
- Permalink
- Notify Moderator
Please attach a Mathcad worksheet with what you had tried so far.
What are you after? equations? 2D-plots? 3D-plots?
- Mark as New
- Bookmark
- Subscribe
- Mute
- Subscribe to RSS Feed
- Permalink
- Notify Moderator
See attached. It should at least show you how to start.
Alan
- Mark as New
- Bookmark
- Subscribe
- Mute
- Subscribe to RSS Feed
- Permalink
- Notify Moderator
Hello, thank you for replying so short.
The plot is 2D, i will reply as soon as i can.
I am getting a wrong format error, i am using Mathcad Prime 2.0
I must appologize, i dont know about anything about inserting radical equations. ![]()
Regards,
Alex.
- Mark as New
- Bookmark
- Subscribe
- Mute
- Subscribe to RSS Feed
- Permalink
- Notify Moderator
- Mark as New
- Bookmark
- Subscribe
- Mute
- Subscribe to RSS Feed
- Permalink
- Notify Moderator
Thank you Alan, thats just wow what you did there, i wish i could find a starter tutorial on mathcad ![]()
- Mark as New
- Bookmark
- Subscribe
- Mute
- Subscribe to RSS Feed
- Permalink
- Notify Moderator
Alexandru Hera wrote:
... i wish i could find a starter tutorial on mathcad
Click on help (the question mark at the top-right of Prime 2). There is a tutorial there:
Alan
- Mark as New
- Bookmark
- Subscribe
- Mute
- Subscribe to RSS Feed
- Permalink
- Notify Moderator
Just note that "Mathcad Prime 2.0 Help Center" now is available on the Internet (it works better with Internet Explorer): http://www.ptc.com/cs/help/mathcad_hc/prime2_hc/index.jspx
- Mark as New
- Bookmark
- Subscribe
- Mute
- Subscribe to RSS Feed
- Permalink
- Notify Moderator
For better explaining Alan, hope you can understand exacly whan i need ![]()
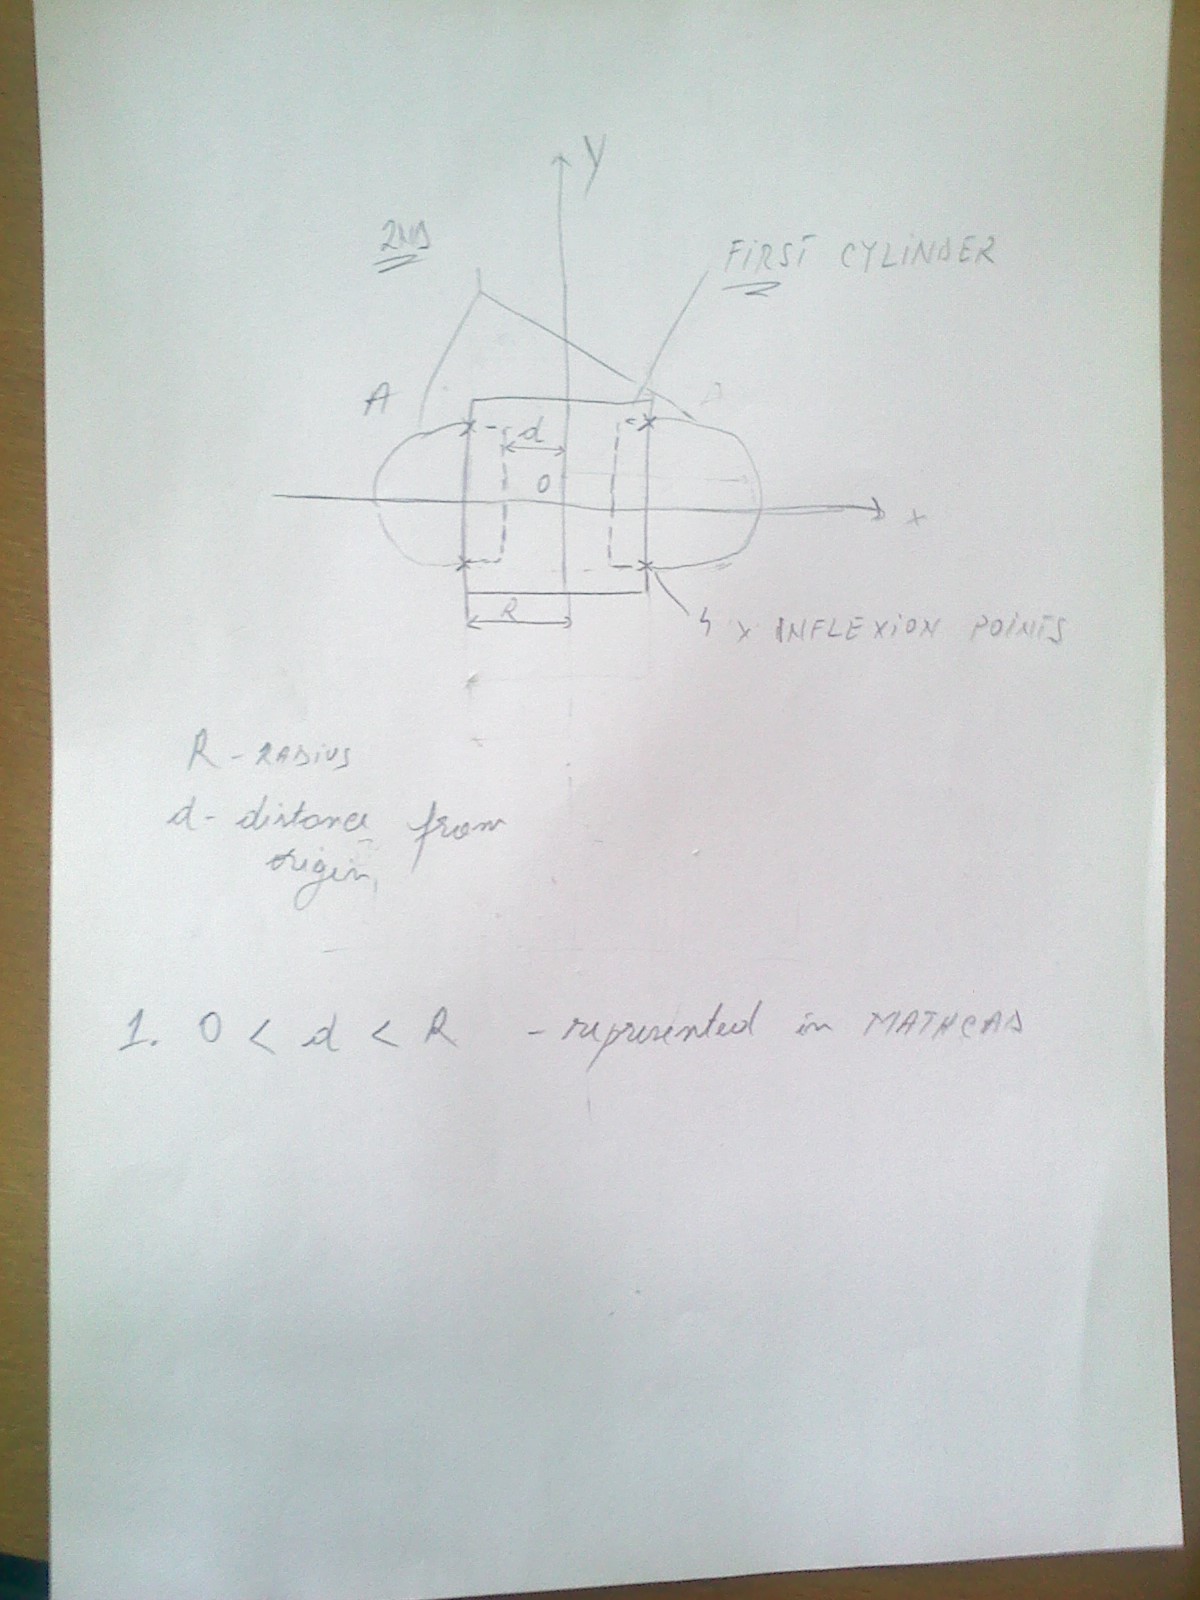
the first scenario allows me to alocate multiple values to d and represent them.
- Mark as New
- Bookmark
- Subscribe
- Mute
- Subscribe to RSS Feed
- Permalink
- Notify Moderator
Alexandru Hera wrote:
For better explaining Alan, hope you can understand exacly whan i need
...
Err...no!
1. What is the orientation of your 2nd cylinder? 2. What, exactly is it you are trying to calculate? Your first post suggested a number of discrete values of d. Are you now looking for a plot of y as a function of d?
I'm afraid I'll need a more detailed explanation/better drawings (make them 3D?).
Alan
- Mark as New
- Bookmark
- Subscribe
- Mute
- Subscribe to RSS Feed
- Permalink
- Notify Moderator
Well, i am trying to calculate y based on the d value, 2d not 3d ![]()
The orientation is straight throught the first, like a nail.
- Mark as New
- Bookmark
- Subscribe
- Mute
- Subscribe to RSS Feed
- Permalink
- Notify Moderator
Alexandru Hera wrote:
Well, i am trying to calculate y based on the d value, 2d not 3d
The orientation is straight throught the first, like a nail.
There are 3 things varying, namely: d, x and y. If you want a 2D plot of y against d you need to specify the value(s) of x at which you want to do this. My previous worksheet plotted y against x for a few values of d.
Alan
- Mark as New
- Bookmark
- Subscribe
- Mute
- Subscribe to RSS Feed
- Permalink
- Notify Moderator
I don't know what the real needs are, either.
It looks to me as if the graph which is described is the flatprojection/unrolling of the intersection of two orthogonal cylinders of same size. d being some kind of offset. d=r meaning that the axis of the cyliniders intersect and the cylinder intersection collapsed into two ellipses which unroll to two sines. But then, i may be wrong - the formulas I came up with are slightly different from those posted.

- Mark as New
- Bookmark
- Subscribe
- Mute
- Subscribe to RSS Feed
- Permalink
- Notify Moderator
Thank you Wernex, that its wha i've tried to explain ![]()
Could not have done it better myself ![]()
Now i need to translate that to a mathcad file.
- Mark as New
- Bookmark
- Subscribe
- Mute
- Subscribe to RSS Feed
- Permalink
- Notify Moderator
Alexandru Hera wrote:
Thank you Wernex, that its wha i've tried to explain
But thats exactly what Alan had provided - plotting y over x for selected values of d!!??
Probably his version is more useful to you than mine as he had used the formulas you provided. As I wrote I developed my own and came up with different ones. So what you see might look like what you are after but possibly is different in one respect or another.
Unfortunately you didn't provide more comprehensive informations on what you are trying to do and what the goal at the end would be. Anyway, I wouldn't describe what i had done with the cylinders that "the second is going straigt through the first like a nail".
Now i need to translate that to a mathcad file.
What I did was done with Mathcad, inclusive the animation I attached. But I was using Mathcad 15.
Dou you have access to Mathcad 15 or 14?
- Mark as New
- Bookmark
- Subscribe
- Mute
- Subscribe to RSS Feed
- Permalink
- Notify Moderator
I have a trial Mathcad 2.0 Prime ![]()
- Mark as New
- Bookmark
- Subscribe
- Mute
- Subscribe to RSS Feed
- Permalink
- Notify Moderator
Werner Exinger wrote:
But thats exactly what Alan had provided - plotting y over x for selected values of d!!??
Yes, but perhaps I created confusion by plotting all the sections on a single graph. Here's the d=15 one on it's own.
Alan
- Mark as New
- Bookmark
- Subscribe
- Mute
- Subscribe to RSS Feed
- Permalink
- Notify Moderator
Thank you Alan, im sorry, i was a bit confusing, i've tried to explain as best i could.
The teacher didnt gaved me much info, so just one paper i had, and 3 scenarios to test.
when d gets diferent vaules, equals to R, and equals to 0.
- Mark as New
- Bookmark
- Subscribe
- Mute
- Subscribe to RSS Feed
- Permalink
- Notify Moderator
Making this subject up ![]()
Alan what you did was what i needed, now that i got more details i would like to know if you can help me take this a bit further.
But for the record, my teacher was impressed ![]()
@Werner: the graph you made was really usefull as i got max points for this preview.
- Mark as New
- Bookmark
- Subscribe
- Mute
- Subscribe to RSS Feed
- Permalink
- Notify Moderator
Glad to have helped. To get further help with Mathcad related problems you only need to post your questions here and I and/or others will probably help.
Alan
- Mark as New
- Bookmark
- Subscribe
- Mute
- Subscribe to RSS Feed
- Permalink
- Notify Moderator
Okay, to get started, the title of the paper.
Graphic-analytical study of the curve of intersection of two cylinders of rotation
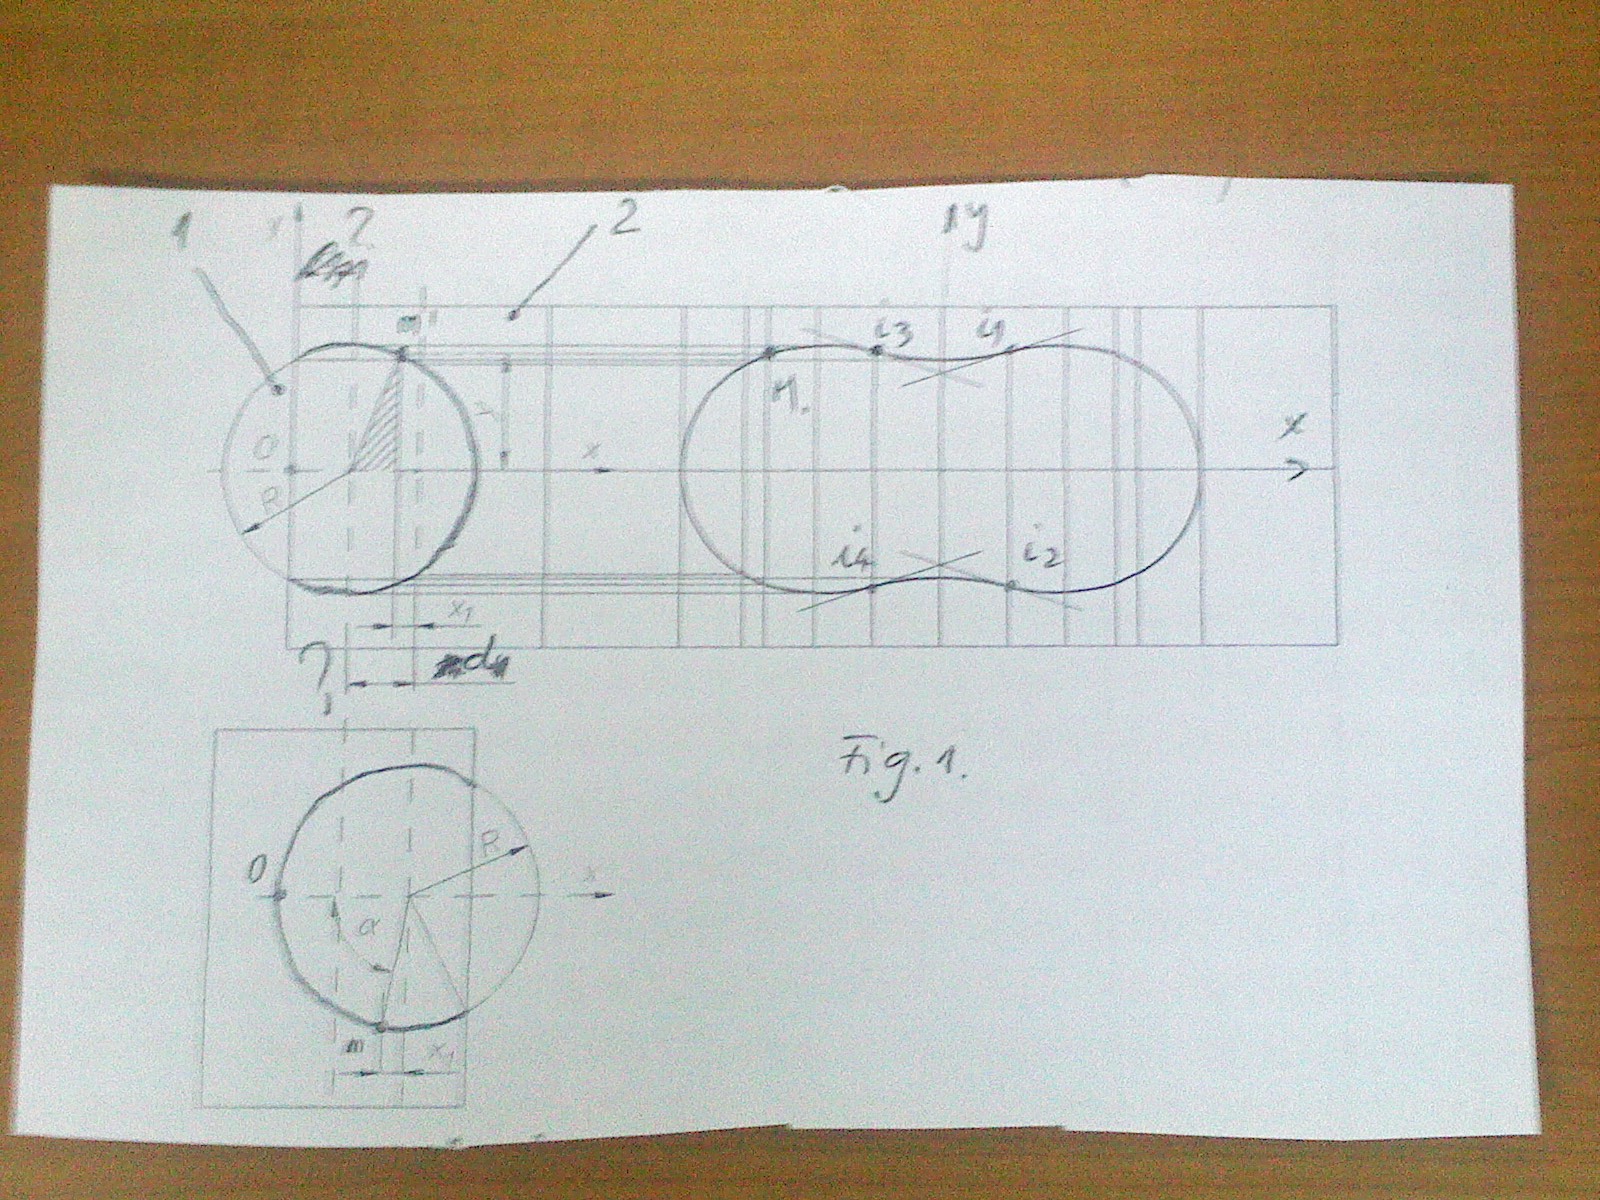
R - circles radius (same size)
d - distance between the cylinders axes
M (m,m') - intersection point
x = Rα (from the horizontal projection)
α = x/R
- Mark as New
- Bookmark
- Subscribe
- Mute
- Subscribe to RSS Feed
- Permalink
- Notify Moderator
So at least a sketch worth the paper drawn on.
As far as I see its exactly the same thing we had before with one exception. The distance d is now more meaningful. In the equation of your first posting the variable d was the difference from R and the new variable d now, This would affect the equation, of course as d=0 now means we have two ellipses as intersection and therefore two sines as flat projection, and d=R would mean a curve without inflection points - exactly the opposite from the prior post.
The equation would be

and if the goal is graphing, then Alan had already provided the way to do.
Think its time for you to fire up Mathcad and create your own worksheet. Come back if there is anything not working.
BTW, in your sketch (is it yours?) you have different x-axis with different meaning - can be confusing.
- Mark as New
- Bookmark
- Subscribe
- Mute
- Subscribe to RSS Feed
- Permalink
- Notify Moderator
Well, from the paper i have y^2= R^2 - (d-x1)^2, but thats so close.
I'll get to work.
- Mark as New
- Bookmark
- Subscribe
- Mute
- Subscribe to RSS Feed
- Permalink
- Notify Moderator
Alexandru Hera wrote:
Well, from the paper i have y^2= R^2 - (d-x1)^2,
The comes from the shades triangle in the vertical view. Not you would have to calculate x1. In the horizontal view you can see that x1=R*cos(alpha) and alpha=x/r (different x here) as of the unrolling of the cylinder.
So the formulas match.
- Mark as New
- Bookmark
- Subscribe
- Mute
- Subscribe to RSS Feed
- Permalink
- Notify Moderator
So i just need to write the formulas and make a graph, or its needed something more complex like Alan did?
- Mark as New
- Bookmark
- Subscribe
- Mute
- Subscribe to RSS Feed
- Permalink
- Notify Moderator
Alexandru Hera wrote:
So i just need to write the formulas and make a graph,
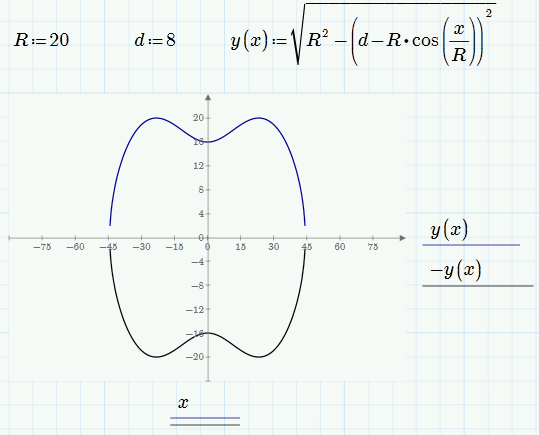
Depends on which formula you are speaking of. If its the formula we discussed in the last posting the answer is no. In a perfect world you could do so, but Mathcad unfortunately does not allow to plot implicit functions. So you will have to write in in terms of y(x):=sqrt(...) and so you will only get the upper half if you plot it. A quick and dirty way to overcome this would be to plot two curves y(x) and -y(x) and format them to look the same. Alan had chosen a more compact, elegant way in that he created vectors for the x and y values which incuded all the necessary points and the whole curve would be plotted by plotting a single expression and not two.
Second Alan had provided a vector for various values of d and plotted all the corresponding curves which might have been confusing.
You will see, no matter whether you use Alans approach or the quick and dirty one sketched above that the plotted curves will not join nicely at the left and right "ends". This is because Mathcad will distribute the points evenly on the x-axis which means the plotted points can be fairly far apart at almost vertical areas in the plot. And Mathcad won't connect the upper and lower half of thr graph - on the first appraoch because it woul not connect two different functioins plotted and in Alans approach beacuse of the NaN (respective complex values, see below) separating the halves.
Alan had provided a way to overcome this or at least lessen that effect as he provided a variable to chose the number of points.
At last the definition of the function. It look more difficult as Alan had provided a way to avoid the function to return complex results - they are substituded for the Mathcad special "constant" NaN (not a number). As far as I see, this would not be necessary, as the plot react on complex numbers pretty the same way as on NaN.
He made the function dependend on R and d, too, as to provide for more flexibility. I would strongly suggest to do so.
So you see, it can be done quick and dirty, but more comfort or more features add complexity.
So a quick and dirty approach would look like the following pic. Start from there and get more aquainted with Mathcad.
- Mark as New
- Bookmark
- Subscribe
- Mute
- Subscribe to RSS Feed
- Permalink
- Notify Moderator
Thank you sir for this detailed explication.
One question before i start working, how can i make a 3d graph similar with the one you provided? mathcad?
- Mark as New
- Bookmark
- Subscribe
- Mute
- Subscribe to RSS Feed
- Permalink
- Notify Moderator
Alexandru Hera wrote:
Thank you sir for this detailed explication.
One question before i start working, how can i make a 3d graph similar with the one you provided? mathcad?
I did it with Mathcad 15. Prime's 3D capabilities are rather limited compared to Mathcad 15 and so a converted sheet would not show anything. I tried it and that was the reason for not attaching the Prime worksheet. Nevertheless I am sure it would be possible to graph the two cylinders and the ciurve of intersection in Prime, too, although Prime lacks a lot of the formattings which Mathacd 15 offers and so it wont be that good looking. Also the creation of animations, like the one I attached at that post in question, is a Mathcad 15 feature which is lacking in Prime.
Best choice of course would be the use of a 3D CAD program, if you have access to.
- Mark as New
- Bookmark
- Subscribe
- Mute
- Subscribe to RSS Feed
- Permalink
- Notify Moderator
- Mark as New
- Bookmark
- Subscribe
- Mute
- Subscribe to RSS Feed
- Permalink
- Notify Moderator
Alexandru Hera wrote:
I've tried to reproduce the results, failed at plot
Whats wrong? Plots look OK here?
You don't see the lower half of y8 because above you have written y15:=stack(... instead of y8:=stack(...
You did this with other vectors, too, so I guess you are not sure what that command y8:=stack(y8,-y8) is for.
It simply stacks the points of the upper half (y8) on top of the points of the lower half of the curve and it would make more sense to assign it a variable with the same number (y8). As you have written it you would have to draw y2 to see the plot for d=14 which doesn't seem to be that comfortable.


