Community Tip - Need to share some code when posting a question or reply? Make sure to use the "Insert code sample" menu option. Learn more! X
- Subscribe to RSS Feed
- Mark Topic as New
- Mark Topic as Read
- Float this Topic for Current User
- Bookmark
- Subscribe
- Mute
- Printer Friendly Page
Mathcad prime 7 / plot error estimates from polyint
- Mark as New
- Bookmark
- Subscribe
- Mute
- Subscribe to RSS Feed
- Permalink
- Notify Moderator
Mathcad prime 7 / plot error estimates from polyint
I try to replicate the example from
Example: Polynomial Interpolation (ptc.com)
How Ian I plot the red error bars?
- Labels:
-
Mathcad Usage
- Mark as New
- Bookmark
- Subscribe
- Mute
- Subscribe to RSS Feed
- Permalink
- Notify Moderator
Ho can I plot the red error bars from plot with polyint?
- Mark as New
- Bookmark
- Subscribe
- Mute
- Subscribe to RSS Feed
- Permalink
- Notify Moderator
- Tags:
- Prime 7.0
- Mark as New
- Bookmark
- Subscribe
- Mute
- Subscribe to RSS Feed
- Permalink
- Notify Moderator
The main reason for your attempt failing is that the example is badly setup, to say the least.
The range variable r is used to index matrices/vectors on one hand also as x-values on the other. This only works for special occasions.
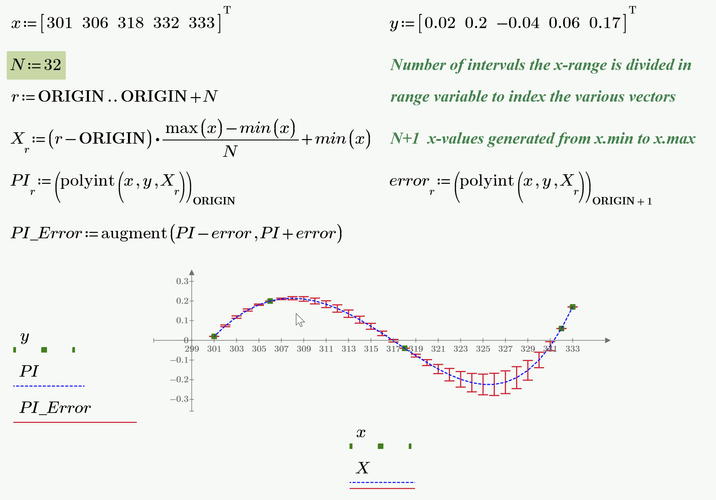
Here is what IMHO is a better approach which lets you select the number of intervals independent of what exactly the x-values are:
N:=32 duplicates the results of the help example,
N:=64 should give you what you obviously had in mind
P6 sheet attached
- Mark as New
- Bookmark
- Subscribe
- Mute
- Subscribe to RSS Feed
- Permalink
- Notify Moderator
why dows
not work?
r:= 0,0.5,..max(x)-min(x)
r:=0..max(x)-min(x) works fine (from example from Mathcad help pages)
- Tags:
- Mathcad Usage
- Mark as New
- Bookmark
- Subscribe
- Mute
- Subscribe to RSS Feed
- Permalink
- Notify Moderator
I don't see the problem?
Works fine, as long as you do NOT type a comma (,) after 0.05
Success!
Luc
- Mark as New
- Bookmark
- Subscribe
- Mute
- Subscribe to RSS Feed
- Permalink
- Notify Moderator
Unfortunately in my case your solution does not work. If you change the statement
r:=0..max(x)-min(x) to r:=0,0.05..max(x)-min(x)
then the next statements do not work anymore (underline r is flagged as error)
- Mark as New
- Bookmark
- Subscribe
- Mute
- Subscribe to RSS Feed
- Permalink
- Notify Moderator
The variable r is defined as a range from 0 to the difference between the highest and lowest values in array x.
Without specifying the second value of that range, you get a range containing only integers 0, 1, 2, 3 ...
This is used for indexing into arrays.
If you change that range to include non-integer values, such as 0.05, then it will start with:
0, 0.05, 0.1, 0.15, 0.2 ...
But those values cannot all be used to index into an array, because for indexing into an array, you can ONLY use integers. That's what the error message is about.
Success!
Luc


