14-Alexandrite
October 15, 2024
Solved

Minimum values depending on layer thickness

  • October 15, 2024
  • 1 reply
  • 3699 views

I need to choose the minimum value of q depending on the layer thickness...

If the layer thickness is =< 2m the q should be the minimum value of ( q;avg or 12MPa) 

if the layer thickness is > 2m q should be the minimum value of ( q;avg or 15MPa) 

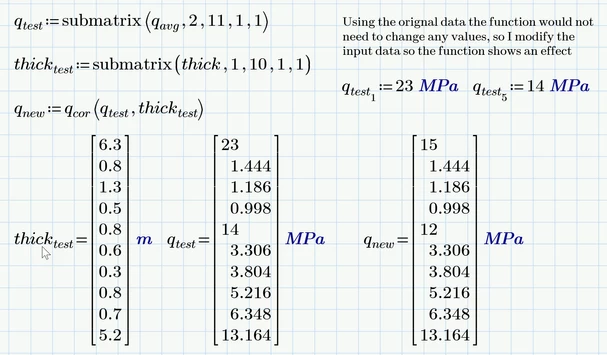
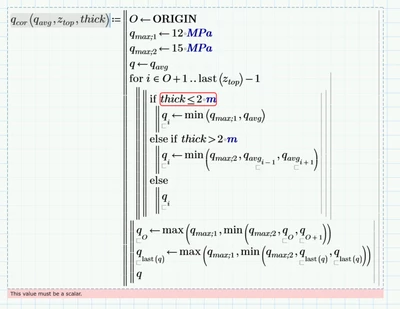
I tried to do it this way, but it is not working. 

YA_10963798_1-1728991682918.png

YA_10963798_2-1728991862728.png


Can you spot the mistake in this , please?

Thanks in advance

Yusra 

Prime 9 page 12


Best answer by Werner_E

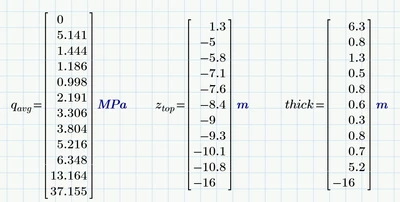
The vector q.avg which you obviously want to modify contains 12 elements.

But the vector thickness contains only 11 elements.

So its not clear which thickness should be assigned to the elements of q.avg.

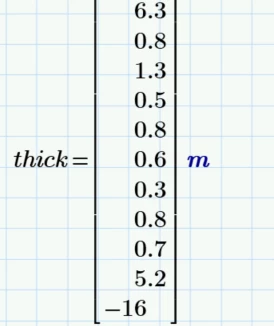
I also wonder about the last entry (-16) in vector thick ...
Werner_E_0-1728995575212.png

I also don't understand your second min usage with three inputs and also not your last max/min combinations. They do not correspond to what you have explained in your text.

So just looking at what you have written that you need, it looks to me that q.avg and thick should be of the same length and that each entry in thick correspond to an entry in q.avg. And if the corresponding thick value to an q.avg value is smaller or larger than 2 m, different upper limits for q are used.

If thats true, you have to provide two vectors of equal length and the following function should do its job.
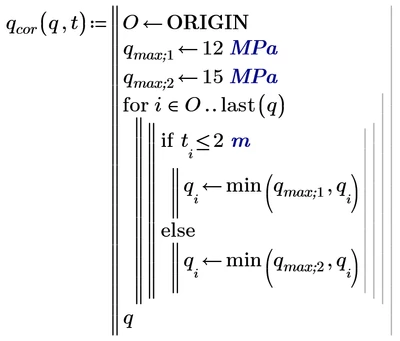
Werner_E_1-1728996635409.png

For example

Werner_E_2-1728996661917.png

Personally I would prefer to write the function just for scalars and then call it vectorized
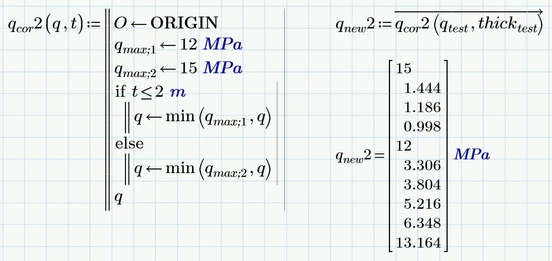
Werner_E_3-1728996867988.png

but that may be subject of personal tast.



1 reply

Werner_E25-Diamond IAnswer
25-Diamond I
October 15, 2024

The vector q.avg which you obviously want to modify contains 12 elements.

But the vector thickness contains only 11 elements.

So its not clear which thickness should be assigned to the elements of q.avg.

I also wonder about the last entry (-16) in vector thick ...

Werner_E_0-1728995575212.png

I also don't understand your second min usage with three inputs and also not your last max/min combinations. They do not correspond to what you have explained in your text.

So just looking at what you have written that you need, it looks to me that q.avg and thick should be of the same length and that each entry in thick correspond to an entry in q.avg. And if the corresponding thick value to an q.avg value is smaller or larger than 2 m, different upper limits for q are used.

If thats true, you have to provide two vectors of equal length and the following function should do its job.

Werner_E_1-1728996635409.png

For example

Werner_E_2-1728996661917.png

Personally I would prefer to write the function just for scalars and then call it vectorized

Werner_E_3-1728996867988.png

but that may be subject of personal tast.


14-Alexandrite
October 15, 2024

Just one question about ( min function) why it works only with scalars ... whenever I want to use it with vectors or matrics  it doesn't work ... 

How to overcome this ? 

Should I always use programming ?


For example the following program : in each (qc;gem;cor ) I have 3 matrics each one has ten values.... what I need is to write a program that will compare the both variables and choose the minimum value of each one ( compare the first raw with the first raw  and chooses the min ...and so on  ) ...and the result should be also one matric with ten values. However, it chooses only the minimum value of each matrics 


YA_10963798_1-1729000045071.png

How can I do this ?


25-Diamond I
October 15, 2024

@YA_10963798 wrote:

Just one question about ( min function) why it works only with scalars ... whenever I want to use it with vectors or matrics  it doesn't work ... 


The "min" function works that way because PTC had chosen to implement it that way. When you feed this function with a couple of scalars, vectors and/or matrices, it will return the overall minimum value of all of them. The same is true for other functions like "max" or "mean". Usually this isn't bad and is exactly what the user wants.

And yes, if you want something different, you have to do a little work on your own to achieve the desired effect.

Lets say you have to vectors v1 and v2 of the same length and want to create a vector similar in size containing the min value of each 'row'.

Werner_E_1-1729004275993.png

There are various ways to achieve this result.
What comes to mind is that we could use the built-in "min" function, but as you already know, this function would just return the overall minimum of all provided values:

Werner_E_2-1729004343347.png

Next idea could be to vectorize this function call. After all this is exactly what vectorization is made for. Unfortunately there are a few function where vectorization has no effect and "min" is one of them

Werner_E_6-1729005858430.png

So one possible workaround could be that we define our own minimum function for two inputs because this function now could be called vectorized:

Werner_E_4-1729004598144.png

Bingo!

Another way, as you wrote yourself, is programming. Looping through the vectors and choosing the minimum in each turn

Werner_E_5-1729004725324.png

And yes, there sure may be even other ways to skin this cat.


 ...and the result should be also one matric with ten values.


That's unclear to me. From what you wrote so far I would have expected that what you want to see is a nested vector which contains THREE 10x1 vectors and not just one ???


Generally I think that your various questions have a greater chance to get answered in your sense by more people if you
1) describe clearly and in more detail verbally what you would like to achieve
2) provide a short(!) sample worksheet with simple variables, stripped down as much as possible instead of providing a 20 or 30 page document with (for me) rather confusing variable names and results stemming from cascading calculations.
You should also state in each new thread from anew which version of Prime you are using even if you already told us so in previous threads. This is especially essential if you are not using the most current version.

3) Provide concrete examples with numbers which possibly show every special case that should be considered and manually write down the exact result value/vector/matrix you would like to see as a result. The more different examples the better.
Its also better not to talk about depths, forces, layers, etc. because there meaning sure are natural for you, but possible not by other people like me 😉

4) Once you got a solution you are satisfied with, you should be able to apply it to the worksheet you are actually working on. If you experience problems doing so, you still can come back and ask for help (its just now that we would need to see your large worksheet with the corresponding data file(s)).


So in case of your current question - why not simply provide a sheet (rather than just a picture) containing two nested vectors v1 and v2, each containing three 4x1 vectors.

They may be generated manually or using random numbers. And then show which data structure with which values you would like to achieve.


Here is what I understood so far from your verbal explanation. The first part not seen in he picture is just the creation of the sample data. You can see it in the attached P9 worksheet.

Werner_E_7-1729005948114.png