
Turn on suggestions
Auto-suggest helps you quickly narrow down your search results by suggesting possible matches as you type.
Showing results for
Please log in to access translation
Turn on suggestions
Auto-suggest helps you quickly narrow down your search results by suggesting possible matches as you type.
Showing results for
Community Tip - You can Bookmark boards, posts or articles that you'd like to access again easily! X
Translate the entire conversation x
Please log in to access translation
Options
- Subscribe to RSS Feed
- Mark Topic as New
- Mark Topic as Read
- Float this Topic for Current User
- Bookmark
- Subscribe
- Mute
- Printer Friendly Page
Numeric display of plotted points - XY plot in Mathcad Prime 3.0
Feb 23, 2015
11:19 AM
- Mark as New
- Bookmark
- Subscribe
- Mute
- Subscribe to RSS Feed
- Permalink
- Notify Moderator
Please log in to access translation
Feb 23, 2015
11:19 AM
Numeric display of plotted points - XY plot in Mathcad Prime 3.0
I was wondering if there is a way for seeing a readout of coordinates of the specific points that make up a trace in an XY plot.
In Mathcad 15 it was possible to right click on a graph and select Trace which displayed the x and y co-ordinates of the nearest point when you clicked on the graph near a point. Is there a way to do this in Prime?
Labels:
- Labels:
-
Other
5 REPLIES 5
Feb 25, 2015
01:44 PM
- Mark as New
- Bookmark
- Subscribe
- Mute
- Subscribe to RSS Feed
- Permalink
- Notify Moderator
Please log in to access translation
Feb 25, 2015
01:44 PM
Is there a way to do this in Prime?
No. One of the many missing features.
Feb 25, 2015
02:02 PM
- Mark as New
- Bookmark
- Subscribe
- Mute
- Subscribe to RSS Feed
- Permalink
- Notify Moderator
Please log in to access translation
Feb 25, 2015
02:02 PM
Feb 26, 2015
04:24 AM
- Mark as New
- Bookmark
- Subscribe
- Mute
- Subscribe to RSS Feed
- Permalink
- Notify Moderator
Please log in to access translation
Feb 26, 2015
04:24 AM
Adding markers is not exactly what I was looking for... But can you set the intersecting point of the markers to follow the trace and then drag one of the markers around?
Feb 26, 2015
08:28 AM
- Mark as New
- Bookmark
- Subscribe
- Mute
- Subscribe to RSS Feed
- Permalink
- Notify Moderator
Please log in to access translation
Feb 26, 2015
08:28 AM
Not in Prime, no. In Mathcad 15 it would be possible to rig up something like that using some scripted controls, but scripted controls are not available in Prime.
Feb 26, 2015
09:40 AM
- Mark as New
- Bookmark
- Subscribe
- Mute
- Subscribe to RSS Feed
- Permalink
- Notify Moderator
Please log in to access translation
Feb 26, 2015
09:40 AM
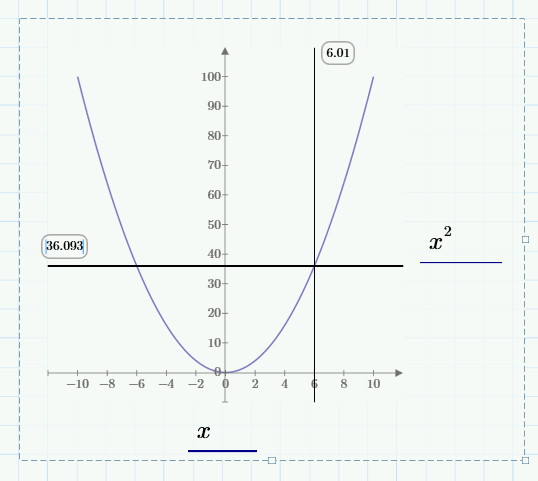
if you are plotting a function, say f(x) versus x, you can define the value of your horizontal cursor as "f(3)". This will set it to the right level, and display the actual value on the graph.


