Community Tip - Need to share some code when posting a question or reply? Make sure to use the "Insert code sample" menu option. Learn more! X
- Subscribe to RSS Feed
- Mark Topic as New
- Mark Topic as Read
- Float this Topic for Current User
- Bookmark
- Subscribe
- Mute
- Printer Friendly Page
Periodic Function Plotting
- Mark as New
- Bookmark
- Subscribe
- Mute
- Subscribe to RSS Feed
- Permalink
- Notify Moderator
Periodic Function Plotting
Hi
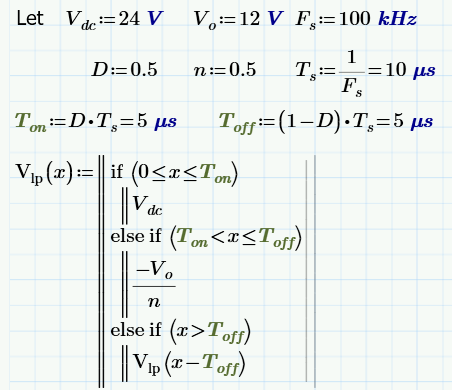
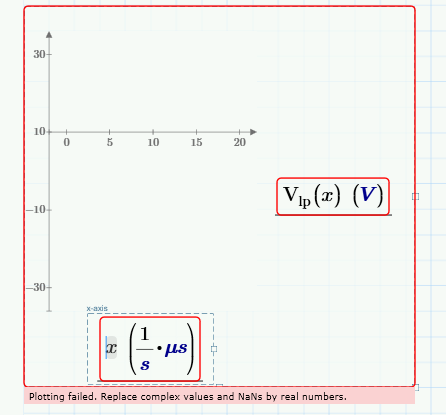
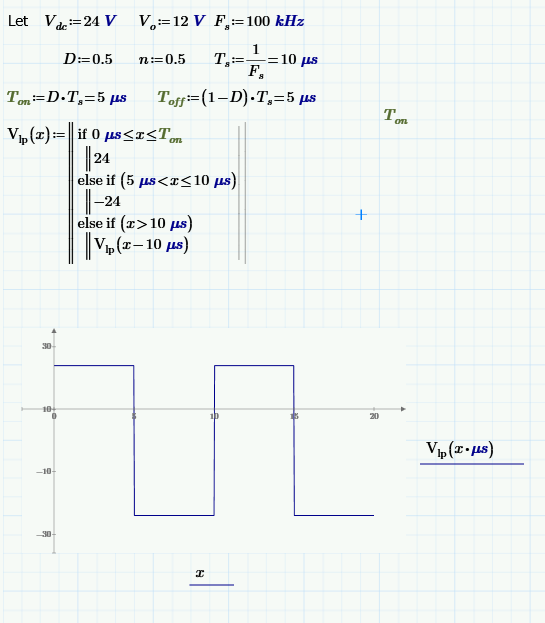
I have been through many posts but i am not able to plot the attached expression. Can you please tell where i am doing mistake?I am expecting a periodic square waveform toggling between +/-24V with on and off period 5us.
Here I used Ton,Toff as a cons; x as a variable and Vlp(x) as a function.
<Unfortunately when instead of Variables I used to substitute assigned Numerical value it works>


Solved! Go to Solution.
Accepted Solutions
- Mark as New
- Bookmark
- Subscribe
- Mute
- Subscribe to RSS Feed
- Permalink
- Notify Moderator
SAMEER GARG wrote:
Hi
I have been through many posts but i am not able to plot the attached expression. Can you please tell where i am doing mistake?I am expecting a periodic square waveform toggling between +/-24V with on and off period 5us.
Here I used Ton,Toff as a cons; x as a variable and Vlp(x) as a function.
<Unfortunately when instead of Variables I used to substitute assigned Numerical value it works>
? I thought we'd looked at this before? You need units in your conditional terms and you need to multiply x by microseconds in the Vlp function in the plot.
Stuart

- Mark as New
- Bookmark
- Subscribe
- Mute
- Subscribe to RSS Feed
- Permalink
- Notify Moderator
Assign x as a range variable over the desired range of the plot.
- Mark as New
- Bookmark
- Subscribe
- Mute
- Subscribe to RSS Feed
- Permalink
- Notify Moderator
By default, when you don't specify a range, Mathcad will plot x from -10 to 10 (IIRC). Evaluation of your function for a negative number fails, causing your error. Richard's fix is the correct answer.
- Mark as New
- Bookmark
- Subscribe
- Mute
- Subscribe to RSS Feed
- Permalink
- Notify Moderator
SAMEER GARG wrote:
Hi
I have been through many posts but i am not able to plot the attached expression. Can you please tell where i am doing mistake?I am expecting a periodic square waveform toggling between +/-24V with on and off period 5us.
Here I used Ton,Toff as a cons; x as a variable and Vlp(x) as a function.
<Unfortunately when instead of Variables I used to substitute assigned Numerical value it works>
? I thought we'd looked at this before? You need units in your conditional terms and you need to multiply x by microseconds in the Vlp function in the plot.
Stuart

- Mark as New
- Bookmark
- Subscribe
- Mute
- Subscribe to RSS Feed
- Permalink
- Notify Moderator
Hi StuartBruff
Thanks a ton.
This really works. Sorry i was not getting reply so that is why i posted in other threads as well. Next time i will make patience.![]()


