Community Tip - If community subscription notifications are filling up your inbox you can set up a daily digest and get all your notifications in a single email. X
- Subscribe to RSS Feed
- Mark Topic as New
- Mark Topic as Read
- Float this Topic for Current User
- Bookmark
- Subscribe
- Mute
- Printer Friendly Page
Planar Regression in Mathcad
- Mark as New
- Bookmark
- Subscribe
- Mute
- Subscribe to RSS Feed
- Permalink
- Notify Moderator
Planar Regression in Mathcad
by Mathcad Staff

About this worksheet:
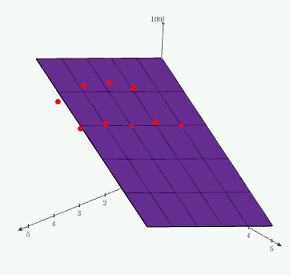
- Fits a plane through 3D data
- Is a generic regression example and can be used in all industries and disciplines
- Uses the PTC Mathcad "regress" function to fit a plane through a set of 3D (x, y, and z) data
This worksheet using PTC Mathcad software provides you with a sample data set that then shows you how to create a matrix containing the x and y coordinates of the data set using the augment function. It also shows you how to perform a regression on the data using the "regress" functions and the following arguments
1. A matrix containing the x and y coordinates of the data set
2. A vector containing the z coordinates of the data set
3. The power of the fit for a plane, the power is 1
The worksheet then shows you how you might graph the plane and the data set using PTC Mathcad software. This worksheet provides you with step by step instruction, sample, data, and solutions to aid you.
Download and explore this worksheet yourself! You can download a free lifetime copy of PTC Mathcad Express and get 30 days of full functionality.
- Labels:
-
Statistics_Analysis


