
Turn on suggestions
Auto-suggest helps you quickly narrow down your search results by suggesting possible matches as you type.
Showing results for
Please log in to access translation
Turn on suggestions
Auto-suggest helps you quickly narrow down your search results by suggesting possible matches as you type.
Showing results for
Community Tip - Did you get an answer that solved your problem? Please mark it as an Accepted Solution so others with the same problem can find the answer easily. X
Translate the entire conversation x
Please log in to access translation
Options
- Subscribe to RSS Feed
- Mark Topic as New
- Mark Topic as Read
- Float this Topic for Current User
- Bookmark
- Subscribe
- Mute
- Printer Friendly Page
Please help - need to plot a function
Aug 14, 2012
10:48 AM
- Mark as New
- Bookmark
- Subscribe
- Mute
- Subscribe to RSS Feed
- Permalink
- Notify Moderator
Please log in to access translation
Aug 14, 2012
10:48 AM
Please help - need to plot a function
Hi, attached are two models - Model function A and B. Each model function consists of parts that i am superimposing with given boundary conditions. However, when i plot each function i don't believe it is plotting the mathematical function for either Model A or Model B. I attach, if anyone can please help me to plot the functions correctly would be much appreciated (it's possible that my actual functions are not written correctly in matchcad). Thank you.
Solved! Go to Solution.
Labels:
- Labels:
-
Other
ACCEPTED SOLUTION
Accepted Solutions
Aug 15, 2012
04:52 AM
- Mark as New
- Bookmark
- Subscribe
- Mute
- Subscribe to RSS Feed
- Permalink
- Notify Moderator
Please log in to access translation
Aug 15, 2012
04:52 AM
Hi Stuart, I don't think there is any need to divide by N. The plot you provide doesn't seem to connect each bounded portion of the curve from it's end point - however it does provide each individual portion/bound correctly. I have sketched next to your curve what i'd expect - does this seem reasonable with the functions i have provided? Thanks , Omar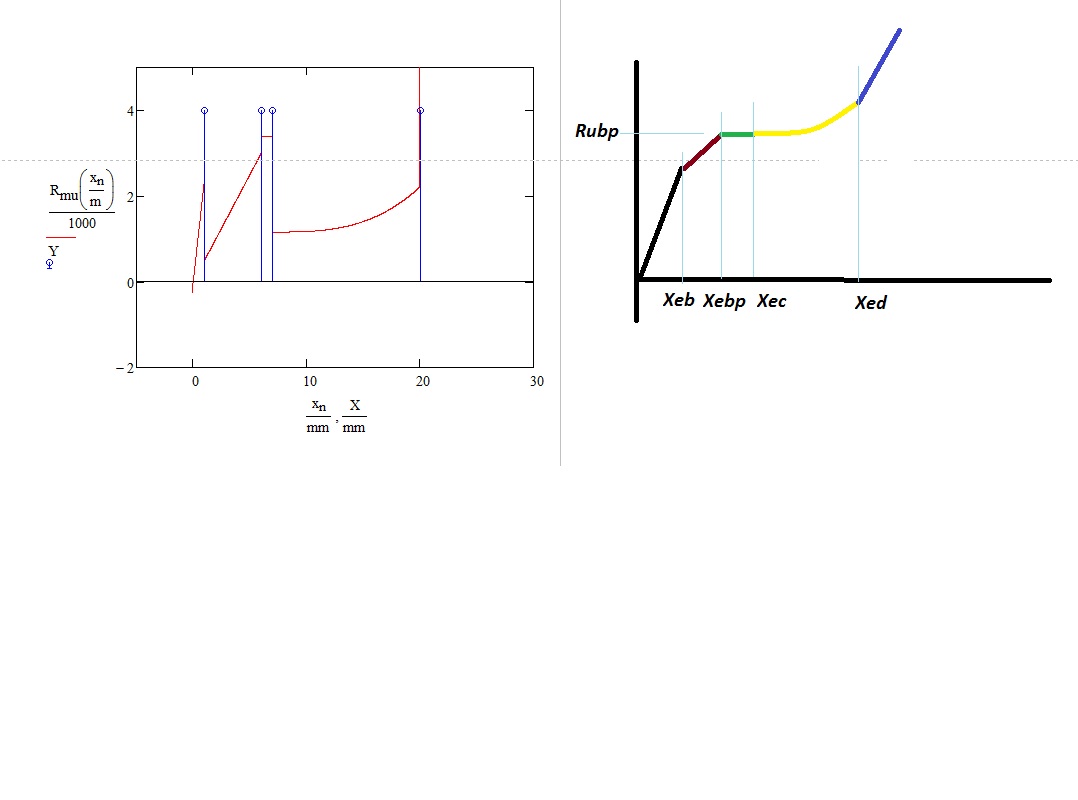
16 REPLIES 16
Aug 14, 2012
10:57 AM
- Mark as New
- Bookmark
- Subscribe
- Mute
- Subscribe to RSS Feed
- Permalink
- Notify Moderator
Please log in to access translation
Aug 14, 2012
10:57 AM
Is it a beam?
Send please the picture of your beam!
Aug 14, 2012
01:34 PM
- Mark as New
- Bookmark
- Subscribe
- Mute
- Subscribe to RSS Feed
- Permalink
- Notify Moderator
Please log in to access translation
Aug 14, 2012
01:34 PM
It is a Beam, however the problem is related to the mathematical function regardless of the structure. Thanks.
Aug 14, 2012
11:45 AM
- Mark as New
- Bookmark
- Subscribe
- Mute
- Subscribe to RSS Feed
- Permalink
- Notify Moderator
Please log in to access translation
Aug 14, 2012
11:45 AM
You have used <= at both ends of your length booleans; this means that you will be counting the end points twice. You need to change one of the limits to < rather than <=.
Stuart
Aug 14, 2012
01:36 PM
- Mark as New
- Bookmark
- Subscribe
- Mute
- Subscribe to RSS Feed
- Permalink
- Notify Moderator
Please log in to access translation
Aug 14, 2012
01:36 PM
Hi stuart. Thanks for your suggestion but when i change the booleans as you suggest it makes no difference to what is being plotted. can you send an example of what you did? perhaps i'm missing something. Thanks
Aug 14, 2012
02:17 PM
- Mark as New
- Bookmark
- Subscribe
- Mute
- Subscribe to RSS Feed
- Permalink
- Notify Moderator
Please log in to access translation
Aug 14, 2012
02:17 PM
Sure, see attached, Omar. Out of interest, why do you think your implementation looks wrong? What do you expect?
Stuart
Aug 14, 2012
02:40 PM
- Mark as New
- Bookmark
- Subscribe
- Mute
- Subscribe to RSS Feed
- Permalink
- Notify Moderator
Please log in to access translation
Aug 14, 2012
02:40 PM
Hi Stuart, thanks for that - Model A looks correct in terms of what i'd expect the curve to look like (it's basically the first 2 bounds of Model B)
However Model B should look like the curve attached. The 3rd bound (where the function is modelled by a cubic) in your model drops, however should start and curve upwards from the end point of the second bound. If you see the attached curve it may make more sense. Thanks, Omar
Thanks, Omar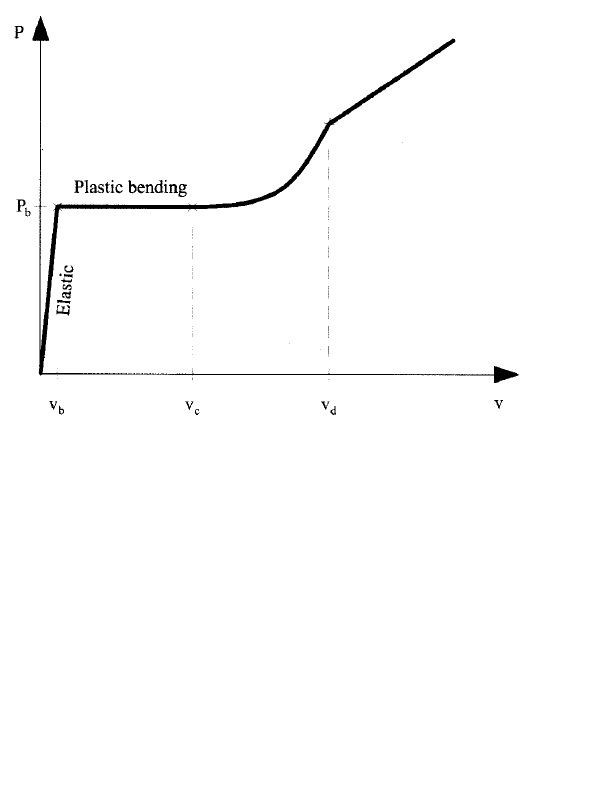
Aug 14, 2012
02:42 PM
- Mark as New
- Bookmark
- Subscribe
- Mute
- Subscribe to RSS Feed
- Permalink
- Notify Moderator
Please log in to access translation
Aug 14, 2012
02:42 PM
sorry curve up from the end of the third bound. Thanks, Omar
Aug 14, 2012
03:39 PM
- Mark as New
- Bookmark
- Subscribe
- Mute
- Subscribe to RSS Feed
- Permalink
- Notify Moderator
Please log in to access translation
Aug 14, 2012
03:39 PM
Just to note that the curve attached does not include the second bound in my function B - really just interested in getting the cubic portion within the prescribed bound to start in the right place.
Aug 14, 2012
06:19 PM
- Mark as New
- Bookmark
- Subscribe
- Mute
- Subscribe to RSS Feed
- Permalink
- Notify Moderator
Please log in to access translation
Aug 14, 2012
06:19 PM
Omar,
Do you want to add terms as you go along?
Aug 15, 2012
04:53 AM
- Mark as New
- Bookmark
- Subscribe
- Mute
- Subscribe to RSS Feed
- Permalink
- Notify Moderator
Please log in to access translation
Aug 15, 2012
04:53 AM
Hi Wayne, i'm not sure that this is correct. See my post below. Thanks, Omar
Aug 15, 2012
06:23 AM
- Mark as New
- Bookmark
- Subscribe
- Mute
- Subscribe to RSS Feed
- Permalink
- Notify Moderator
Please log in to access translation
Aug 15, 2012
06:23 AM
Hello Omar,
I think that you need to look at the function definitions again, as defined there have to be discontinuities at each transition.
I have modified the Xe.bp equation to show how it can be changed but not knowing the physical realities of your system it is difficult to know if this is justifiable or not.
Regards
Andy
Aug 15, 2012
09:30 AM
- Mark as New
- Bookmark
- Subscribe
- Mute
- Subscribe to RSS Feed
- Permalink
- Notify Moderator
Please log in to access translation
Aug 15, 2012
09:30 AM
Hi Andy, many thanks you're right i'm going to look at the functions again. Best, Omar
Aug 15, 2012
02:44 AM
- Mark as New
- Bookmark
- Subscribe
- Mute
- Subscribe to RSS Feed
- Permalink
- Notify Moderator
Please log in to access translation
Aug 15, 2012
02:44 AM
Omar Al-Omar wrote:
Just to note that the curve attached does not include the second bound in my function B - really just interested in getting the cubic portion within the prescribed bound to start in the right place.
Hi Omar,
As far as I can tell, the cubic portion does start in the right place ... but you need to change the drawing units to make sense of it; your grid is too coarse. Do you really mean to divide the R functions by kN (you divide by N in the function definition)?
Stuart
Aug 15, 2012
04:52 AM
- Mark as New
- Bookmark
- Subscribe
- Mute
- Subscribe to RSS Feed
- Permalink
- Notify Moderator
Please log in to access translation
Aug 15, 2012
04:52 AM
Hi Stuart, I don't think there is any need to divide by N. The plot you provide doesn't seem to connect each bounded portion of the curve from it's end point - however it does provide each individual portion/bound correctly. I have sketched next to your curve what i'd expect - does this seem reasonable with the functions i have provided? Thanks , Omar
Aug 15, 2012
08:19 AM
- Mark as New
- Bookmark
- Subscribe
- Mute
- Subscribe to RSS Feed
- Permalink
- Notify Moderator
Please log in to access translation
Aug 15, 2012
08:19 AM
Unfortunately, I don't know sufficient about the problem to comment on "reasonableness", Omar. I think the equations are now displaying what's implemented and it isn't necessarily unreasonable (from my limited Wiki-gained knowledge) to see some discontinuties (but perhaps not as many as you see). Could you post the actual equations (or reference to a source) and check the values? If you take each equation separately, then the end of one and the beginning of the next should give near enough the same value if there are to be no discontinuities.
Stuart
Aug 15, 2012
09:10 AM
- Mark as New
- Bookmark
- Subscribe
- Mute
- Subscribe to RSS Feed
- Permalink
- Notify Moderator
Please log in to access translation
Aug 15, 2012
09:10 AM
Thanks Stuart, appreciate all your help on this problem. As a function, you're right it is displaying what's programmed. Thanks for introducing me to the programming approach in Mathcad. Best, Omar


