Community Tip - Did you get called away in the middle of writing a post? Don't worry you can find your unfinished post later in the Drafts section of your profile page. X
- Subscribe to RSS Feed
- Mark Topic as New
- Mark Topic as Read
- Float this Topic for Current User
- Bookmark
- Subscribe
- Mute
- Printer Friendly Page
Plot Failing due to 'Not evaluating to real values?"
- Mark as New
- Bookmark
- Subscribe
- Mute
- Subscribe to RSS Feed
- Permalink
- Notify Moderator
Plot Failing due to 'Not evaluating to real values?"
Hello,
I'm unsure why the plot isn't plotting, either a 3D or a 2D Contour Plot. I'm wanting to show what is basically a T vs. P graph for an isentropic senario. I'd like to plot either the surface or a contour. (A couple curves in a 2D graph would work as well). I'm just unsure what is incorrect in the syntax.
Solved! Go to Solution.
- Labels:
-
Other
Accepted Solutions
- Mark as New
- Bookmark
- Subscribe
- Mute
- Subscribe to RSS Feed
- Permalink
- Notify Moderator
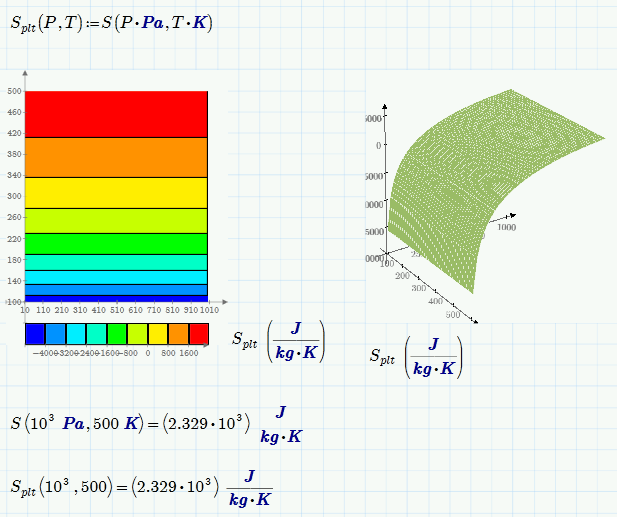
Because you want to plot the function, you just need to put 'S' on the contour. I've re-defined 'S' to add in the units.
- Mark as New
- Bookmark
- Subscribe
- Mute
- Subscribe to RSS Feed
- Permalink
- Notify Moderator
- Mark as New
- Bookmark
- Subscribe
- Mute
- Subscribe to RSS Feed
- Permalink
- Notify Moderator
Fred Kohlhepp wrote:
3D plot wants a matrix.
Not necessarily. It would also be happy with a more complex nested arrays structure created by CreateMesh or a simple function of two arguments. The point in the latter case is that the arguments are not allowed to have units and as we cannot specify arguments in the 3D plot placeholder we are forced to either rewrite the functiion to be plotted or create an auxiliary function as Roger and I have shown.
BTW, is there a delay in the appearance of postings here? I think I haven't seen neither Fred's nor Roger's post before I sent mine. But then, I may have been sloppy and didn't look carefully enough.
- Mark as New
- Bookmark
- Subscribe
- Mute
- Subscribe to RSS Feed
- Permalink
- Notify Moderator
Because you want to plot the function, you just need to put 'S' on the contour. I've re-defined 'S' to add in the units.
- Mark as New
- Bookmark
- Subscribe
- Mute
- Subscribe to RSS Feed
- Permalink
- Notify Moderator
A better way to deal with 3D-plots would be the use of CreateMesh() as it gives you better control.
If you want to use the functions directly, you have to define an auxiliary function. While Prime is making progress in that respect, units still are not generally accepted and you have to get rid of them for abcissa and ordinate. Units are only allowed for the applicate ("z"-axis). You tried to get rid of them, but the syntax of 3D-plots does not allow to state arguments but only the function name.

- Mark as New
- Bookmark
- Subscribe
- Mute
- Subscribe to RSS Feed
- Permalink
- Notify Moderator
Sorry, what is the substance. What is its Origin of formula?
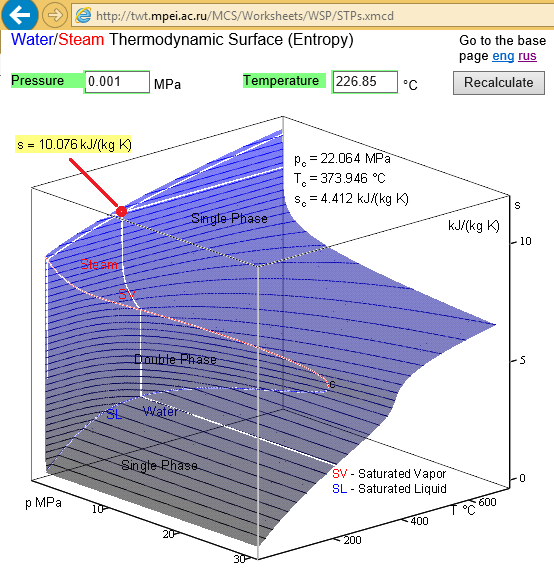
For water/steam - IAPWS-IF97:on the Mathcad 15 Server:

I have a lot of same plots for a others substances..
- Mark as New
- Bookmark
- Subscribe
- Mute
- Subscribe to RSS Feed
- Permalink
- Notify Moderator
- Mark as New
- Bookmark
- Subscribe
- Mute
- Subscribe to RSS Feed
- Permalink
- Notify Moderator
Sorry for the late answer all, and thank you for the responses.
To start with, this is part of my homework for my graduate thermodynamics course. It is more focused on the fundemental equations of state and the maxwell relations and bridgeman's table and looking at table generation. Current text is Advanced Engineering Thermodynamics by Adrian Bejan (3rd Ed.)
I have fixed the values to more closely align with the values in my current thermo text by Shapiro; sheet attached. The two equations displayed are curve fit lines to model water near its density maximum. I had an error of using a high temperature and pressure input is to be from 1atm to 100 atm.
I'm not so much as concerned about the value outputs as I am in proving the isentopic curves are 'cup-shaped'. My initial intent was to just show through a basic graph (regarless of the units) that the isentropic curves would be parabola's in the T-P plane. But, it seems that the graphs displayed are not doing that, but rather I shall need to modify my entropy expression algebraically.
I have also attached the article refererence to the equations and is the reference used by Bejan.
- Mark as New
- Bookmark
- Subscribe
- Mute
- Subscribe to RSS Feed
- Permalink
- Notify Moderator
Sorry, it is one old equations.
Now we use IAPWS-IF97
See please for water (region 1 - for Mathcad 15, Prime and SMath)
- Mark as New
- Bookmark
- Subscribe
- Mute
- Subscribe to RSS Feed
- Permalink
- Notify Moderator
Here is the specific volume plot plotted on the 2nd page.


