Community Tip - When posting, your subject should be specific and summarize your question. Here are some additional tips on asking a great question. X
- Subscribe to RSS Feed
- Mark Topic as New
- Mark Topic as Read
- Float this Topic for Current User
- Bookmark
- Subscribe
- Mute
- Printer Friendly Page
Plot contours of specific values
- Mark as New
- Bookmark
- Subscribe
- Mute
- Subscribe to RSS Feed
- Permalink
- Notify Moderator
Plot contours of specific values
Hi!
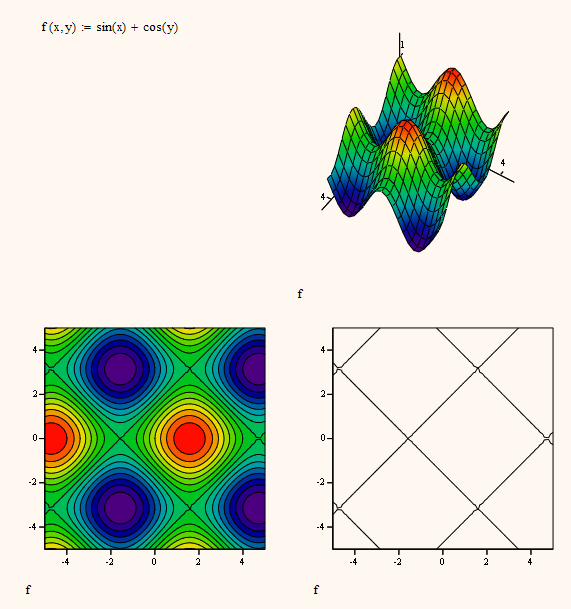
Given a two-variable function f(x,y) I want to plot the contour of f=0, is that possible?
/Johannes
- Labels:
-
Other
- Mark as New
- Bookmark
- Subscribe
- Mute
- Subscribe to RSS Feed
- Permalink
- Notify Moderator
Can you post a worksheet with an example of your function f and to show the version of Mathcad you use.
In MC15 you would get what want if you make a (3D) contourplot, go to the "Special" tab in the format window uncheck "Auto Contour" and chose 1 as "number".
Unfortunately Mathcad's 2D.plot is not able to graph implicit functions.

- Mark as New
- Bookmark
- Subscribe
- Mute
- Subscribe to RSS Feed
- Permalink
- Notify Moderator
Exactly! What I want to do is to plot an implicit function in 2D but have to go via a contour plot. See the attached file, I want the 0 contour ONLY.
At the end of the sheet is another problem I have. If I plot the contours of a function with large values, the plot will start to disappear out of the plot frame, as you can see in the figure below.
I am using version 14.
- Mark as New
- Bookmark
- Subscribe
- Mute
- Subscribe to RSS Feed
- Permalink
- Notify Moderator
I am sorry, I was wrong with the contour plot and setting number to 1. As you pointed out in your file It does not show the contour for z=0, at least not always. I should have checked numbering.
The effect with f2 is strange, I would call it abug which is still present in the current MC 15. It has to do with the factor 10^7. If you change that scaling to 10^6 it seems to be OK, if you change it to 10^8 the plot disappears completely.
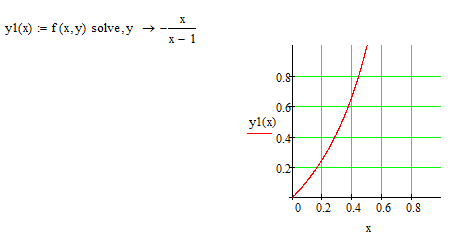
As for the contour for z=0, they are easy in case of your two functions f and f2. The equation f=0 can very easy be solved for y and then the graph in 2D been plotted. Unfortunately thats not possible with the majority of implicit function. In case of f2 it is cleary seen that f2=0 collapses in x=0 OR y=0, so the contour are the two axis.
Unfortunately not a push button solution which works for all function. Plotting of implicit functions is a long standing wish of Mathcad users, but I doubt we will it implemented in the near future.


