- Subscribe to RSS Feed
- Mark Topic as New
- Mark Topic as Read
- Float this Topic for Current User
- Bookmark
- Subscribe
- Mute
- Printer Friendly Page
Plot function
- Mark as New
- Bookmark
- Subscribe
- Mute
- Subscribe to RSS Feed
- Permalink
- Notify Moderator
Plot function
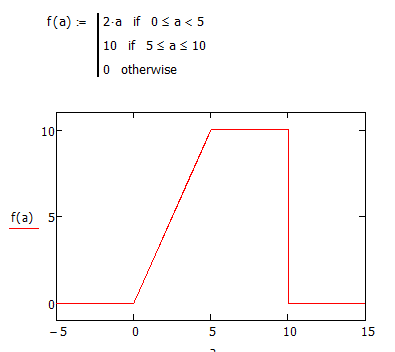
We want to define a function that gives the values
f (a) = 2a when a is between 0 and 5
f (a) = 10 when a is between 5 and 10
f (a) = 0 all other times
and then plot the function with that range −5 < a < 15
I have tried it but my plot just don't seem right look at the attachment. can you show me how to do it in MATHCAD
- Mark as New
- Bookmark
- Subscribe
- Mute
- Subscribe to RSS Feed
- Permalink
- Notify Moderator
I have tried it but my plot just don't seem right look
Why? Your plot is showing exactly what you want with just one exception - there is nothing plotted in the range from-5 to 0, because your function is not providing values for a<0. This can be repaired if you replace the last if-statement by an otherwise-statement.
For further questions please note that its adviseable to attach your worksheet, not just a screenshot.
- Mark as New
- Bookmark
- Subscribe
- Mute
- Subscribe to RSS Feed
- Permalink
- Notify Moderator
What you have is correct (or almost correct, anyway). What makes you think it's wrong?
The graph would look better if you changed the y axis limits a little. If you click on the plot you will see placeholders at the top and bottom of the axis. Try typing in -1 and 11 for the limits.
Also, your function is technically not quite correct. The second line says that if a=10 then the result should be 10, but the third line says if a=10 then the result should be 0. The statements should not overlap. Also, replace the last one with "otherwise", which also covers the case when a<0.


