Community Tip - You can Bookmark boards, posts or articles that you'd like to access again easily! X
- Subscribe to RSS Feed
- Mark Topic as New
- Mark Topic as Read
- Float this Topic for Current User
- Bookmark
- Subscribe
- Mute
- Printer Friendly Page
Plot not working
- Mark as New
- Bookmark
- Subscribe
- Mute
- Subscribe to RSS Feed
- Permalink
- Notify Moderator
Plot not working
I guess something is not working with units for my plot can someone have a look and tell me what's wrong
Solved! Go to Solution.
- Labels:
-
Mathcad Usage
Accepted Solutions
- Mark as New
- Bookmark
- Subscribe
- Mute
- Subscribe to RSS Feed
- Permalink
- Notify Moderator
Additional to what Luc already said:
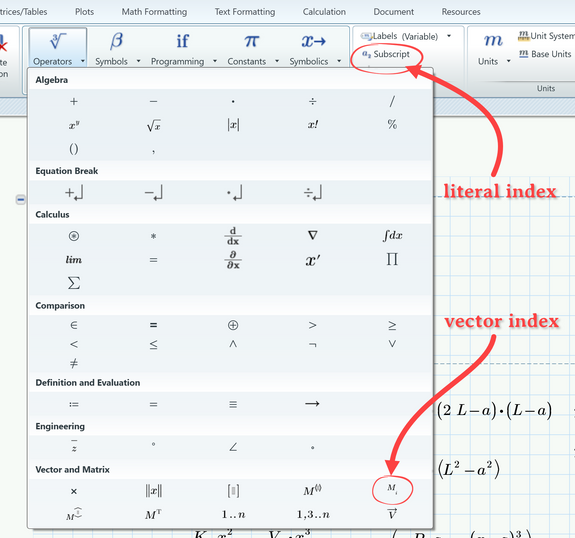
.) Don't use vector/matrix indices unless you really want to create vectors. Use literal indices instead.
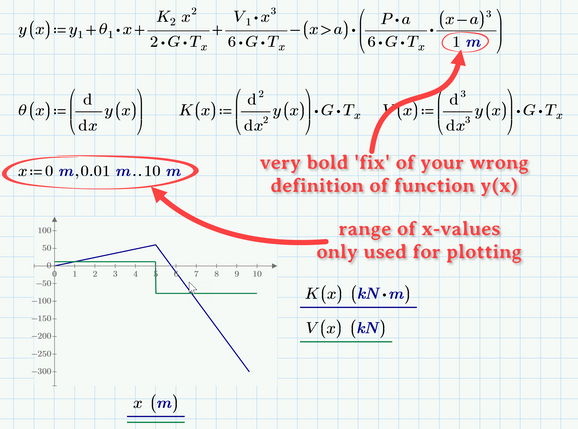
.) if you wan to create a plot with units at the x-axis, you have to define a range for the x-values:
Prime 9 sheet attached
- Mark as New
- Bookmark
- Subscribe
- Mute
- Subscribe to RSS Feed
- Permalink
- Notify Moderator
Check your formulae.
y(x) adds y1 to k1x^2/2*G*Tx. y1 has units [m] and k1x^2/2*G*Tx has units [1/m].
You cannot add apples and pears.
Success!
Luc
- Mark as New
- Bookmark
- Subscribe
- Mute
- Subscribe to RSS Feed
- Permalink
- Notify Moderator
Additional to what Luc already said:
.) Don't use vector/matrix indices unless you really want to create vectors. Use literal indices instead.
.) if you wan to create a plot with units at the x-axis, you have to define a range for the x-values:
Prime 9 sheet attached


