
Turn on suggestions
Auto-suggest helps you quickly narrow down your search results by suggesting possible matches as you type.
Showing results for
Please log in to access translation
Turn on suggestions
Auto-suggest helps you quickly narrow down your search results by suggesting possible matches as you type.
Showing results for
Community Tip - You can subscribe to a forum, label or individual post and receive email notifications when someone posts a new topic or reply. Learn more! X
Translate the entire conversation x
Please log in to access translation
Options
- Subscribe to RSS Feed
- Mark Topic as New
- Mark Topic as Read
- Float this Topic for Current User
- Bookmark
- Subscribe
- Mute
- Printer Friendly Page
Plotting Frequency Distribution Data in PTC Mathcad
Jun 10, 2013
09:55 AM
- Mark as New
- Bookmark
- Subscribe
- Mute
- Subscribe to RSS Feed
- Permalink
- Notify Moderator
Please log in to access translation
Jun 10, 2013
09:55 AM
Plotting Frequency Distribution Data in PTC Mathcad
by Julio C.Banks
About this worksheet:
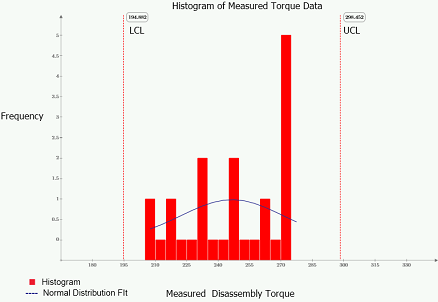
This worksheet shows you how to use PTC Mathcad to calculate a frequency distribution for values in a vector that fall in a specified number of bins within the range of the data, and how to plot the resulting histogram. There is step by step instruction on how to enter a vector of torque data and an in-depth overview of the Outliner Limit Equation, as well as a description and graph of a Shewhart plot. This worksheet provides a particular data set for Torque and demonstrates how you would solve using PTC Mathcad. Instruction, notation, formulas, equations, and 4 separate graphs are included to aid you.
Download and explore this worksheet yourself! You can download a free lifetime copy of PTC Mathcad Express and get 30 days of full functionality.
Labels:
- Labels:
-
Statistics_Analysis
0 REPLIES 0


