cancel
Showing results for 
Search instead for 
Did you mean: 
cancel
Showing results for 
Search instead for 
Did you mean: 

Community Tip - New to the community? Learn how to post a question and get help from PTC and industry experts! X

Plotting Multiple (Array of) Vectors

smasanam
1-Newbie

Plotting Multiple (Array of) Vectors

Hi,

I am trying to plot a graph against two different functions (FunctionX on X-axis and FunctionY on Y-axis). I would like to know if a graph can be prepared with the following:

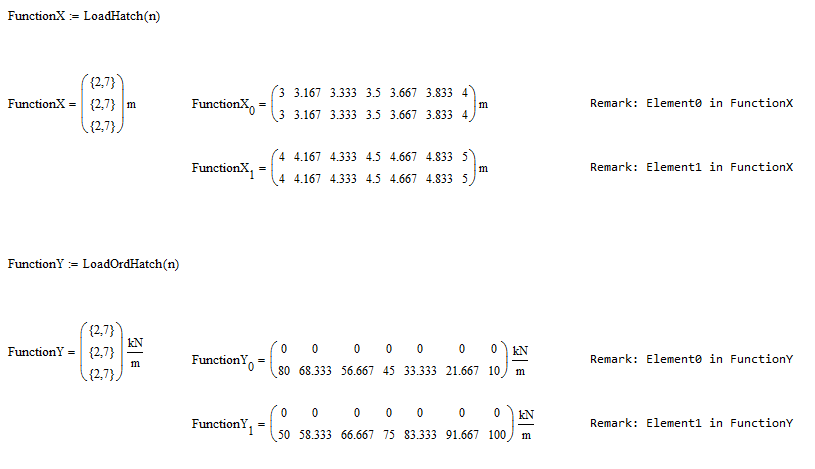
1. FunctionX returns a matrix of size 'm x 1' in which each element is again a matrix of size of '2 x n'

2. FunctionY also returns a matrix of size 'm x 1' in which each element is again a matrix of size of '2 x n'.

Can some suggest me on how to plot this into 2D graph.

Results of the Functions are indicated in the image below.

Multiple Vectors.PNG

Thanks in Advance

3 REPLIES 3

And what exactly do you expect to see in your 2D.plot?

This is what I am expecting to plot.

Graph.PNG

Though, I can able to achieve this modifying the 'n' vector elements by merging in to a single vector, I want to know if this can be by directly providing the variable name (of the matrix of vectors) on the X and Y axes.

Attach please the Mathcad sheet and we try to do with it something

Top Tags