Community Tip - If community subscription notifications are filling up your inbox you can set up a daily digest and get all your notifications in a single email. X
- Subscribe to RSS Feed
- Mark Topic as New
- Mark Topic as Read
- Float this Topic for Current User
- Bookmark
- Subscribe
- Mute
- Printer Friendly Page
Plotting a Cylinder
- Mark as New
- Bookmark
- Subscribe
- Mute
- Subscribe to RSS Feed
- Permalink
- Notify Moderator
Plotting a Cylinder
Hello...
All I'm trying to do is plot a plaine, old cylinder in MC 15 in 3D. There is nothing about it, and what I have found anywhere, including PTC is not explained, discussed or elaborated upon.
Can SOMEONE tell me how in the world to plot a 3D cylinder in Mathcad 15 please.
Thank you
Solved! Go to Solution.
Accepted Solutions
- Mark as New
- Bookmark
- Subscribe
- Mute
- Subscribe to RSS Feed
- Permalink
- Notify Moderator
There may not be explicitely a cylinder shown there but the built in help and tutorial shows you how to plot a parametric surface, a parabolic cylinder and surfaces of revolution, which should help get you starting.
Searching this forum brings up a few links which might be of interest to you:
http://communities.ptc.com/message/202454#202454
http://communities.ptc.com/message/165035#165035
http://communities.ptc.com/message/73592#73592
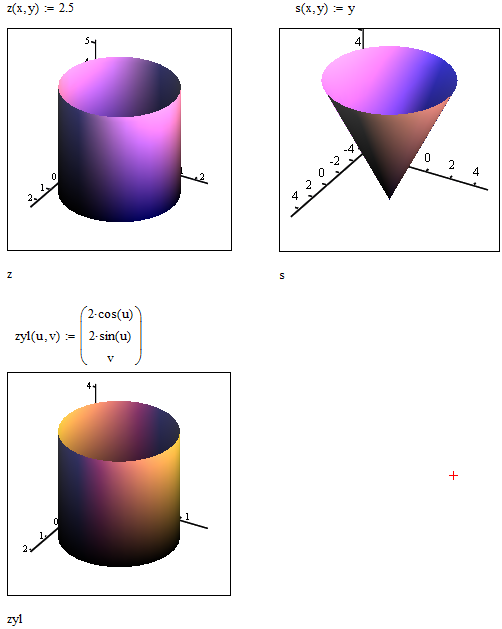
The easiest way to plot a circular cylinder sure is to use Mathcads feature to use cylindrical coordinates instead of cartesian. Next easier is the use of a simple parametric represenration - both shown in the attached file. You may also use CreateMesh, plot a matrix or do it by other means. It all depends upon your needs.

- Mark as New
- Bookmark
- Subscribe
- Mute
- Subscribe to RSS Feed
- Permalink
- Notify Moderator
Werner Exinger wrote:
The easiest way to plot a circular cylinder sure is to use Mathcads feature to use cylindrical coordinates instead of cartesian.
Yes.
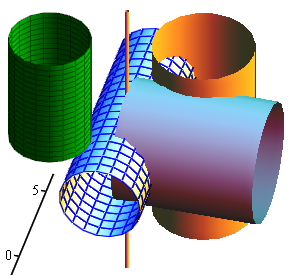
One my picture from old book

- Mark as New
- Bookmark
- Subscribe
- Mute
- Subscribe to RSS Feed
- Permalink
- Notify Moderator
Hi Werner...
Thank you for taking this time to answer my question! I'm not new to this sort of thing (math software), but 'new' to Mathcad. I liked your post, but I don't see how to control the aspects of the solids ---- radius, height, etc.
That is what I have been trying to figure out since seeing your response, which was very helpful. I have used Mathcad in the past but it was version 6 and it was a long time ago. I recalled having to provide the values for each variable in a plot, and these examples here don't seem to have any 'parameters' at all. I don't seem to be able to vary the shape's dimensions, which is puzzling and frustrating, but I need to spend more time with the information to see if I can understand what's going on.
I will be able to spend some more time after today looking through the resources you provided. The plots you gave are great, but I just don't know how to adapt them yet. ![]()
- Mark as New
- Bookmark
- Subscribe
- Mute
- Subscribe to RSS Feed
- Permalink
- Notify Moderator
You can format 3D-plots by selecting the plot and chose rom the menu Format/Graph/3D PLot, or even simpler by double clicking on the plot.
The option you are searching are on the QuickPLotData tab. In case of the first plot I had chosen Coordinate System cylindrical and change Range1 and Range2 (which are by default from -5 to 5). You are allowed to type 2*pi in these options but unfortunately we cannot place variables there. So the radius is controlled by the 2.5 in the equation. Range1 is the circumfence, if you change it to run from 0 to pi, you get only half the cylinder. Range2 controls the height (cylinder coordinates).
In the second example, the radius is the 2 in the equations first and second elelement, and again the other options are the same as in the first example.
You won't see much change in the plot if you graph a single cylinder alone as in the axis tab for all three axis auto scale is chosen by default, so the plot will fill the box as good a possible and all you may notice are changes at the axis ticks.
- Mark as New
- Bookmark
- Subscribe
- Mute
- Subscribe to RSS Feed
- Permalink
- Notify Moderator
The plots you gave are great, but I just don't know how to adapt them yet.
Adapt for ..? We don't know what you are trying to do.
Maybe you find that you have better control using CreateMesh(). Find attached a small routine to create cylinders with axis parallel to x-, y- or z-axis, given radius and height and with a translation (a,b,c) applied. You may also add two more parameters to control the mesh size - I leave it at the default settings.
You should also chose "Equal scale" at the first tab in the format menu.

- Mark as New
- Bookmark
- Subscribe
- Mute
- Subscribe to RSS Feed
- Permalink
- Notify Moderator
Hello Werner...
Thanks again for the answer.
I was thinking it was possible to create a mathcad 15 program that plotted a cylinder, had variables for the height, and radius, possibly even thickness.
This way those variables (parameters) could be changed within the program, and the corredsponding plot of the cylinder would reflect those changes.
I don't want to access the 'format' menu for the plot area to make these changes to the plot of the cylinder. I thought it should be possible to include this kind of control in the program itself. Maybe mathcad cannot do this....I don't know. I'm trying to figure out mathcad's functionality.
I'm just getting to this now, so I will review the other responses you have given. So I shall thank you for those now.....very nice. Hopefully I can see how to make mathcad do these seemingly simple tasks.
- Mark as New
- Bookmark
- Subscribe
- Mute
- Subscribe to RSS Feed
- Permalink
- Notify Moderator
I was thinking it was possible to create a mathcad 15 program that plotted a cylinder, had variables for the height, and radius, possibly even thickness.
Thats exactly what my last sheet does. Without thickness, as we do plots of surfaces and not solids. After all its not a CAD program like Creo.
Nevertheless we are unfortunately not able to set parameters like color, colormap, transparency, light, etc. via Mathcad variables - we have to preset them using the format menu.
- Mark as New
- Bookmark
- Subscribe
- Mute
- Subscribe to RSS Feed
- Permalink
- Notify Moderator
I appreciate your effort, but what you provided was not addressing my need for a simple, basic program for a noob to mathcad.
After a lot of work, I FINALLY managed to create what I needed. I attached it for you.
Thank you for making the effort....your time was truly appreciated and valued. ![]()
- Mark as New
- Bookmark
- Subscribe
- Mute
- Subscribe to RSS Feed
- Permalink
- Notify Moderator
The matrices you created "manually" using the range variables can be created automatically using CreateMesh. Your definition of z() could be simply theata (w/o cos) and apply a range from 0 to height.
But ist fine you finally found what you were looking for.
- Mark as New
- Bookmark
- Subscribe
- Mute
- Subscribe to RSS Feed
- Permalink
- Notify Moderator
But I think that's what was giving me problems (CreateMesh). What was being done behind the scenes wasn't clear for me, and it wasn't clear how to change the shape of the cylinder.
I was afraid of changing "z()"....lol...I tried that in other iterations and it caused terrible problems. I'm sure that was because there were other issues with what I was doing.....my fault, but yes, I think I will go back later today when I have some more time and make that change.
The Help in mathcad doesn't seem to really 'help' me on many things. This whole exercise was one of them, but I guess it takes getting use to, like anything else.....that painful learning curve, but thanks for the attention and willingness to feed ideas my way. ![]()
- Mark as New
- Bookmark
- Subscribe
- Mute
- Subscribe to RSS Feed
- Permalink
- Notify Moderator
Do You know wath is ir Creo(+Mathcad)
- Mark as New
- Bookmark
- Subscribe
- Mute
- Subscribe to RSS Feed
- Permalink
- Notify Moderator
Sorry....I don't understand what you're saying.
- Mark as New
- Bookmark
- Subscribe
- Mute
- Subscribe to RSS Feed
- Permalink
- Notify Moderator


