- Subscribe to RSS Feed
- Mark Topic as New
- Mark Topic as Read
- Float this Topic for Current User
- Bookmark
- Subscribe
- Mute
- Printer Friendly Page
Plotting a graph of the function f(x)
- Mark as New
- Bookmark
- Subscribe
- Mute
- Subscribe to RSS Feed
- Permalink
- Notify Moderator
Plotting a graph of the function f(x)
Hi all,
I am a newbie to the usage of mathcad and could do with some step by step help from you experts out there.
I have a mathcad problem:
I want to plot a graph of the function f(x) from the equation;
f(x) = x(14-7x)(16-7x)
4(4-x)^2
I do not want to show the equation in the worksheet (and so imagine there will be some packets of data on the sheet somewhere that can be referenced to).
From the information I need to plot a graph of the function f(x) (repeated myself didn't I).
I would like the graph needs to cover the interval [0, 2.68] in the x direction and [0, 80] in the y direction.
If anybody can help (step by step because I'm thick....lol). I woul;d be really grateful.
Paul
Solved! Go to Solution.
- Labels:
-
Statistics_Analysis
Accepted Solutions
- Mark as New
- Bookmark
- Subscribe
- Mute
- Subscribe to RSS Feed
- Permalink
- Notify Moderator
Mathcad will evaluate rhe inequality as a boolean expression (1 for true, 0 for false.) You can also use if/otherwise.
- Mark as New
- Bookmark
- Subscribe
- Mute
- Subscribe to RSS Feed
- Permalink
- Notify Moderator
Paul Sunderland wrote:
Hi all,
I am a newbie to the usage of mathcad and could do with some step by step help from you experts out there.
I have a mathcad problem:
I want to plot a graph of the function f(x) from the equation;
f(x) = x(14-7x)(16-7x)
4(4-x)^2
I do not want to show the equation in the worksheet (and so imagine there will be some packets of data on the sheet somewhere that can be referenced to).
From the information I need to plot a graph of the function f(x) (repeated myself didn't I).
I would like the graph needs to cover the interval [0, 2.68] in the x direction and [0, 80] in the y direction.
If anybody can help (step by step because I'm thick....lol). I woul;d be really grateful.
Paul
I'm assuming you can't find the help files! This is basic stuff.
- Mark as New
- Bookmark
- Subscribe
- Mute
- Subscribe to RSS Feed
- Permalink
- Notify Moderator
Fred,
thank you for your assistance.
I know this is basic stuff but I am new to mathcad and learning the ropes.
I haven't found the help files yet (but will now they have been mentioned).
Obviously this isn't the exact or full question on the topic as I intend to work through it and by gleening a few similar examples I will quickly become proficient.
After the equation is (0<x<16), will that be difficult to add or do I just type it in (after all this is wysiwyg??)
I got the feeling that I had to add in a couple of matrices or blocks of data to evalute into the plot with x:= and y:= and so on(but your solution does the business).
thank you for your valuable input
Pau
- Mark as New
- Bookmark
- Subscribe
- Mute
- Subscribe to RSS Feed
- Permalink
- Notify Moderator
Mathcad will evaluate rhe inequality as a boolean expression (1 for true, 0 for false.) You can also use if/otherwise.
- Mark as New
- Bookmark
- Subscribe
- Mute
- Subscribe to RSS Feed
- Permalink
- Notify Moderator
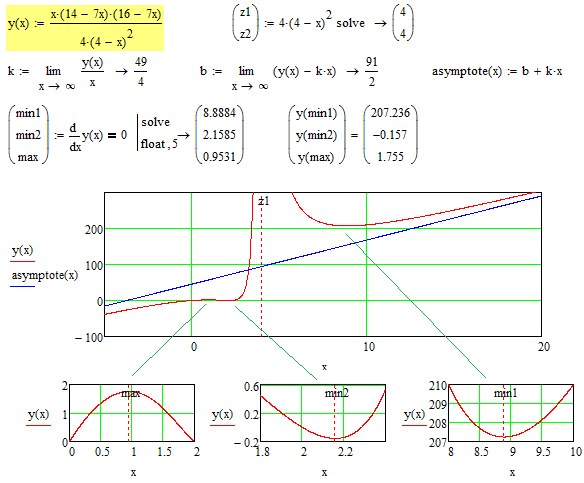
You can not only plot a graph but do an analyses the function (as my students):

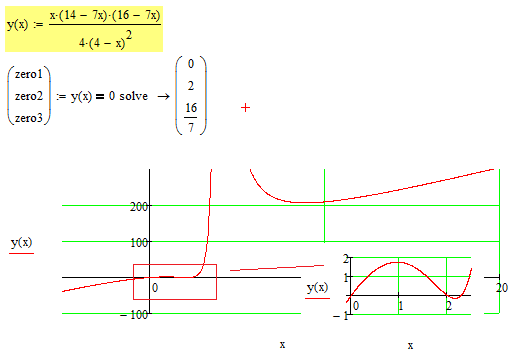
And zeros too:

- Mark as New
- Bookmark
- Subscribe
- Mute
- Subscribe to RSS Feed
- Permalink
- Notify Moderator
Hello!
Please see the attachment. And you have forgotten to mention what version of Mathcad you use?
- Mark as New
- Bookmark
- Subscribe
- Mute
- Subscribe to RSS Feed
- Permalink
- Notify Moderator
And what about Mathcad Prime?
- Mark as New
- Bookmark
- Subscribe
- Mute
- Subscribe to RSS Feed
- Permalink
- Notify Moderator
Sorry guys, should have mentioned, mathcad 14
Thank you all, I know who to contact in future, you have all been great.
And once again thank you to Fred who sparked the initial idea
- Mark as New
- Bookmark
- Subscribe
- Mute
- Subscribe to RSS Feed
- Permalink
- Notify Moderator
You're welcome.


