Community Tip - Did you know you can set a signature that will be added to all your posts? Set it here! X
- Subscribe to RSS Feed
- Mark Topic as New
- Mark Topic as Read
- Float this Topic for Current User
- Bookmark
- Subscribe
- Mute
- Printer Friendly Page
Plotting/calculating transfer functions
- Mark as New
- Bookmark
- Subscribe
- Mute
- Subscribe to RSS Feed
- Permalink
- Notify Moderator
Plotting/calculating transfer functions
Hi,
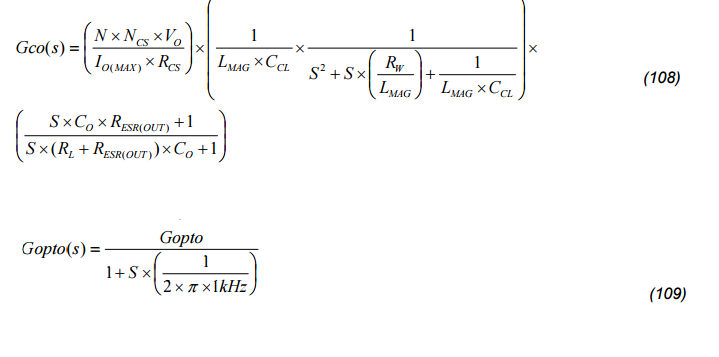
I am fairly new to Mathcad and I am trying to do the following from the data sheet. I need to make both of these plots and haven't got a clue where to start. If anyone can help it would be REALLY appreciated.

- Labels:
-
Statistics_Analysis
- Mark as New
- Bookmark
- Subscribe
- Mute
- Subscribe to RSS Feed
- Permalink
- Notify Moderator
The problem is most likely that Mathcad doesn't know what "p" is. Place the cursor immediately after the p, and hit <Ctrl> g. It should change to the Greek letter pi. However, as Adrien says, a better way of doing it is to type "deg" into the units placeholder.
- Mark as New
- Bookmark
- Subscribe
- Mute
- Subscribe to RSS Feed
- Permalink
- Notify Moderator
As there is no (obvious) way to add a second Y-axis to the plot,
There is no way to add a second axis in Prime.
- Mark as New
- Bookmark
- Subscribe
- Mute
- Subscribe to RSS Feed
- Permalink
- Notify Moderator
Thanks guys for all your help, its been much appreciated. I think I'm pretty much there thanks to you guys.
Is there a way to you can add ta second axis in Mathcad 15?
- Mark as New
- Bookmark
- Subscribe
- Mute
- Subscribe to RSS Feed
- Permalink
- Notify Moderator
right click on the plot, select format:
this will bring up a pop-up window
check the "Enable secondary Y axis" box.
- « Previous
-
- 1
- 2
- Next »


