Community Tip - New to the community? Learn how to post a question and get help from PTC and industry experts! X
- Subscribe to RSS Feed
- Mark Topic as New
- Mark Topic as Read
- Float this Topic for Current User
- Bookmark
- Subscribe
- Mute
- Printer Friendly Page
Plotting columns of a matrix
- Mark as New
- Bookmark
- Subscribe
- Mute
- Subscribe to RSS Feed
- Permalink
- Notify Moderator
Plotting columns of a matrix
I have defined 2 range variables and an equation that uses these variables to create a matrix.
I would like to plot specific columns of this matrix against one of the range variables.
I have tried everything I can think of. Running out of ideas.
I am a student trying to learn Mathcad.
Would appreciate any suggestions. Thanks !
- Labels:
-
Other
- Mark as New
- Bookmark
- Subscribe
- Mute
- Subscribe to RSS Feed
- Permalink
- Notify Moderator
Example:

Success!
Luc
- Mark as New
- Bookmark
- Subscribe
- Mute
- Subscribe to RSS Feed
- Permalink
- Notify Moderator
Luc,
Thank you so much for your reply. I appreciate your help !
Below are my variables and my equation. I would like to plot the first and last columns of the matrix L against the range variable d.
It seems like I'm doing something similar to your example (thanks for posting that !)
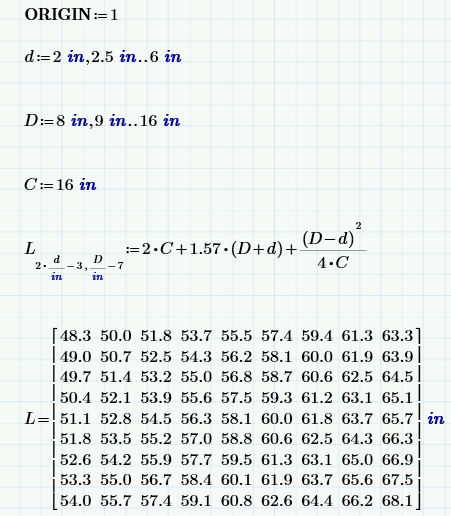

The error shown around L says . . . "These array elements must be scalars. They cannot be vectors or matrices".
I'm confused . . . what am I doing wrong ?
Would appreciate any help. Thanks again !
- Mark as New
- Bookmark
- Subscribe
- Mute
- Subscribe to RSS Feed
- Permalink
- Notify Moderator
- Mark as New
- Bookmark
- Subscribe
- Mute
- Subscribe to RSS Feed
- Permalink
- Notify Moderator
The subscript designation for a matrix element is row, column. To plot the second column you would need the second subscript to be (ORIGIN+1). To plot against range variable I, the subscript would be M[I,ORIGIN+1.
Luc's approach was a bit different; the superscript <ORIGIN> chooses a whole specific column of the matrix, then the single subscript specifies the row. Same effect.
- Mark as New
- Bookmark
- Subscribe
- Mute
- Subscribe to RSS Feed
- Permalink
- Notify Moderator
Thanks Fred, I appreciate your comments !
I'm trying to plot a whole column of the matrix L, specifically the first column, against the range variable d.
So I would like to plot a curve with the data points as :
Pt 1. x = first value of the range variable d, y = first value of the first column of matrix L
Pt 2. x = second value of the range variable d, y = second value of the first column of matrix L
.
.
etc
This doesn't seem like it would be this tough, but I'm struggling.
Would appreciate any help. Thanks !
- Mark as New
- Bookmark
- Subscribe
- Mute
- Subscribe to RSS Feed
- Permalink
- Notify Moderator
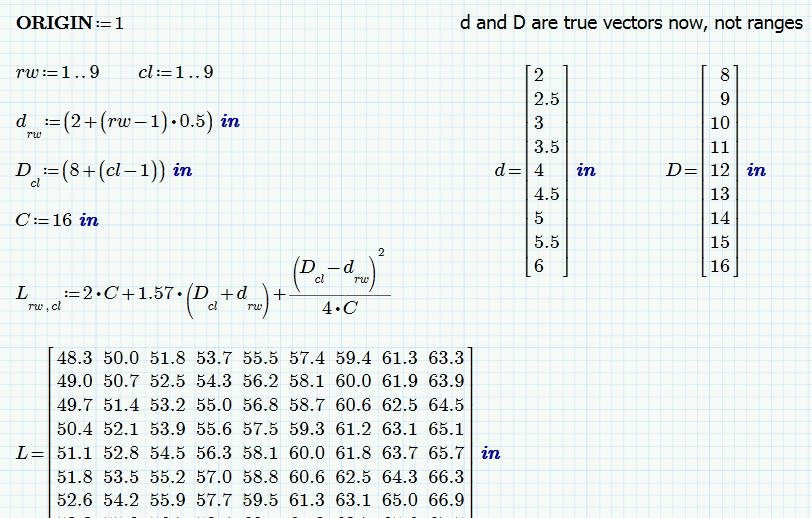
How about making d and D true vectors instead of just range variables and plot vector against vector.
Using the waterfall plot you may even plot every column in L against d at the same time

Werner
- Mark as New
- Bookmark
- Subscribe
- Mute
- Subscribe to RSS Feed
- Permalink
- Notify Moderator
Hello Werner, thank you very much for your help and the file you posted !
If I evaluate the range variables "d" and "D", shouldn't this turn them into vectors ?
Unfortunately, after doing this I still have the same plotting problem.
Something curious I noticed . . . if I turn the range variables into vectors BEFORE the calculation for the matrix "L", the equation for "L" no longer works.
Does my equation for "L" depend on "d" and "D" being range variables and not vectors ?
I'm sorry my questions are so basic. Please excuse my ignorance.
I'm very new to Mathcad, just trying to learn.
Thanks again for all your help !

- Mark as New
- Bookmark
- Subscribe
- Mute
- Subscribe to RSS Feed
- Permalink
- Notify Moderator
Just spotted this reply of yours.
If I evaluate the range variables "d" and "D", shouldn't this turn them into vectors ?
Unfortunately - no. Its still a range even though it looks like a vector.
That's the problem and that's also the reason Fred an me had created d as a vector. Fred used the default setting for ORIGIN (0) which makes some expressions a little bit simpler.
As written in another answer there is an undocumented trick to quickly turn a range into a vector (d:=d=) but there also are more "official" ways and routines available to do so. The subject turns up ever so often here in the forum.
See my other answer elsewhere in this thread for a paper of Stuart describing the difference between vectors and ranges in more detail.
WE
- Mark as New
- Bookmark
- Subscribe
- Mute
- Subscribe to RSS Feed
- Permalink
- Notify Moderator
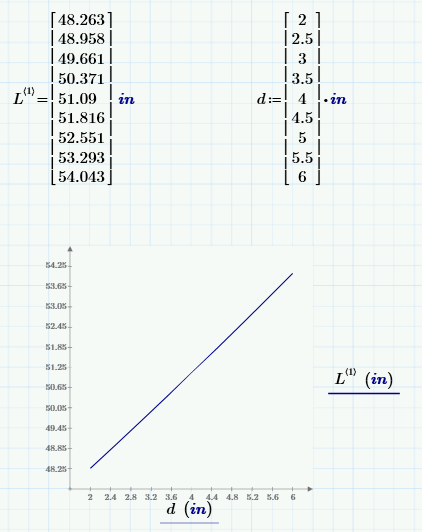
If I manually define the variable "d" by keying in the values to create a vector, then the plot works fine !
There is something about the way I'm using the range variable "d" when trying to plot that is creating my problem.
Sorry if I'm missing something obvious.
I feel like there is something important here that I don't understand and need to learn.
Thanks again !
- Mark as New
- Bookmark
- Subscribe
- Mute
- Subscribe to RSS Feed
- Permalink
- Notify Moderator
> I feel like there is something important here that I don't understand and need to learn.
Yes, you are right. The thing you have to learn is the difference between a range variable and a vector.
> Sorry if I'm missing something obvious.
No, unfortunately its in no way obvious.
The d you just had created is a true vector, not a range variable and you sure can plot one vector against another (as in my first approach where I made d a vector, too.
Range variables look very much the same as vectors in Prime and thats quite annoying and confusing.
There are only a couple of situations where you should use range variables:
*) as index for matrices and vectors
*) defining a range for plotting
*) as a count variable in a program for-loop
You cannot plot a vector against a range, you have to turn that range into a vector first. There is an undocumented feature: if you write d:d= (that is: you define d as being d and follow immediately by an evaluation) this procedure turn d into a vector. That way your sheet would work. In my first sheet I showed a different way to create that vector d using normal scalar range variables to index that vector.
Stuart Bruff wrote some papers about ranges versus vectors quite a while ago. While they cover older versions of Mathcad, most of whats written there still applies. I attach pdf's of those articles.
Werner
- Mark as New
- Bookmark
- Subscribe
- Mute
- Subscribe to RSS Feed
- Permalink
- Notify Moderator
Here is another approach. It looks like you are thinking "spreadsheet" but luckily you are using a math program now.
So you don't have to create a table just to get values or do a plot.
Use functions instead for better flexibilty:
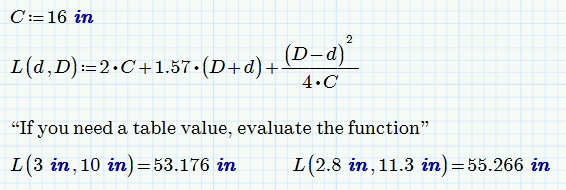
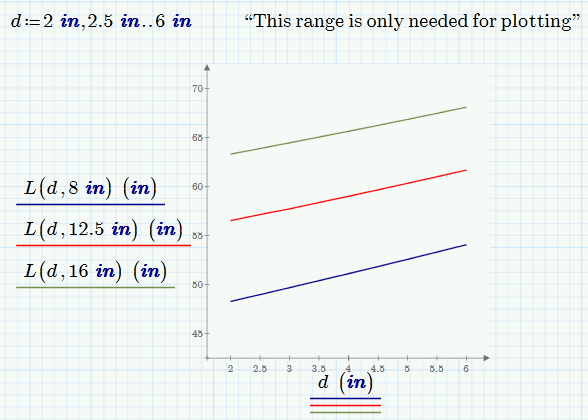
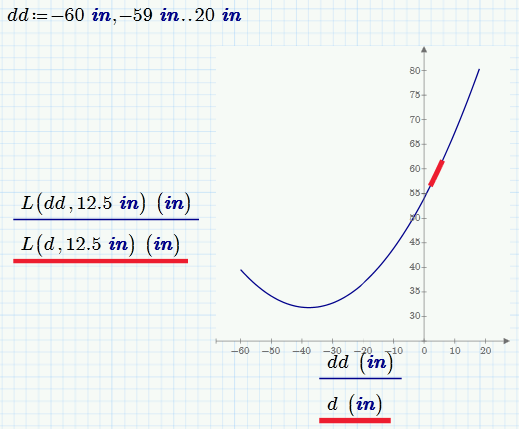
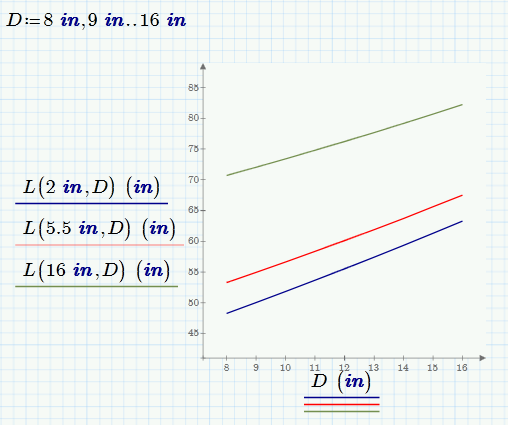
Or you can show how L depends on D (that would mean plotting the rows of your table L against D)
And you may show the part of the 3D paraboloid which seems to be of interest

But unfortunately Primes 3D plot capabilities are mediocre up to unusable. Its not worth trying as editing the few things we can customize in a 3D plot is a real PITA.
Werner
- Mark as New
- Bookmark
- Subscribe
- Mute
- Subscribe to RSS Feed
- Permalink
- Notify Moderator
Hello Werner,
I appreciate all your comments and the alternate way of doing things.
Unfortunately, the homework assignment I'm working on wants me to use range variables and generate a matrix of values.
I then need to plot certain columns of the matrix against one of the range variables.
Again, I appreciate all of your help, but I'm sort of constrained on the approach I can use to do this.
Thanks again, your support is greatly appreciated !
- Mark as New
- Bookmark
- Subscribe
- Mute
- Subscribe to RSS Feed
- Permalink
- Notify Moderator
- Mark as New
- Bookmark
- Subscribe
- Mute
- Subscribe to RSS Feed
- Permalink
- Notify Moderator
Thanks Fred !
Let me study what you posted for a while . . . hopefully I can understand what's going on.
Thanks again !
- Mark as New
- Bookmark
- Subscribe
- Mute
- Subscribe to RSS Feed
- Permalink
- Notify Moderator
If I define them as range variables, the equation works fine and the matrix is generated.
BUT, I can't plot the range variable "d".

If I evaluate the range variables when they are defined, thus making them vectors, the equation then doesn't work.
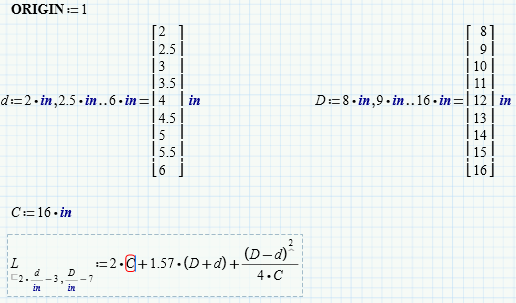
The error on the equation states . . . "This variable must be an integer".
But the variable "C" is defined immediately above the equation as 16.
Seems like I need "d" and "D" to be range variables for the equation to work, but then I need them to be vectors to be able to plot them.
UUUGGGHHH, I'm so confused.
How does this work ? !
- Mark as New
- Bookmark
- Subscribe
- Mute
- Subscribe to RSS Feed
- Permalink
- Notify Moderator
> Seems like I need "d" and "D" to be range variables for the equation to work, but then I need them to be vectors to be able to plot them.
Yes, exactly! Thats perfectly true. And the way you used the ranges d and D to index L by making them unitless and transform them in the range from 1,2..9 was rather creative and worked but is in my opinion an absolute no-go.
Solutions of how to do it in a more "natural" way by using unitless range variables to index your vectors and your matrix was shown by Fred an me in previous posts. Something to read about ranges vs vectors was posted by me here also some time ago.
You say that your homework assignment wants you to use range variables and generate a matrix of values. Thats exactly what Freds approach and my first sheet is doing - using ranges to index/create the data vectors d and D and the data matrix L. You should never use data(!) to index a matrix - thats not a good habit and failure prone.
Whats the exact wording of your assignment?
WE
- Mark as New
- Bookmark
- Subscribe
- Mute
- Subscribe to RSS Feed
- Permalink
- Notify Moderator
Hi Werner,
You asked about the exact wording of my assignment. Here it is :
"Display a matrix of data showing belt lengths when the diameter, 'd', of the driver pulley ranges from 2 to 6 inches in 0.5 inch increments and the diameter, 'D', of driven pulley ranges from 8 to 16 inches in one inch increments. The centerline distance, C is constant at 16 inches. Set your array origin to 1. Format the resulting matrix to display as a table with results displayed to one decimal place. Use units in your calculations."
Eventually I will have a question about formatting the matrix to display as a table. But I figured one miracle at a time. I'll worry about formatting the matrix as a table after I figure out the equation and the plotting.
Thanks again, all of your help is greatly appreciated !
- Mark as New
- Bookmark
- Subscribe
- Mute
- Subscribe to RSS Feed
- Permalink
- Notify Moderator
Obviously English is not my first language but to me it does not seem that the wording of the assignment really means, that you have to define range variables for d and D. It doesn't really mean, that you have to define any variables for d an D. You just have to create a table with the values, when d and D are in the given ranges. You could create the table even by using a function for the belt length and a program using nested for-loops, I guess.
A (not recommended) way to get your approach to work is shown below in a former answer.
Formatting a matrix as a table is quite easy. Open the "Result Format" pop-up either via menu (Format-Result) or by double clicking, go to tab "Display Option" and set "Matrix display style" from the default "automatic" to "table".
When you have done so, you may again right-click at the table and select the desired alignment of the table and in "Properties" you get the option to change the font and font size for the values and also decide if you want to see the roe and column headers. You can only change the the width and height of the cells if you have those headers visible, so you should disable the headers only after you had adjusted the cell width.
EDIT: Sorry - this was for Mathcad 15 and below - not Prime.
The term "table" means something different in Prime than in MC15 and tables in Prime have to be typed in manually and as far as I know there is no way to turn a (calculated) matrix into a table.
Possibly that part of your assignment stems from a time when students were using Mathcad 15 ?
WE
- Mark as New
- Bookmark
- Subscribe
- Mute
- Subscribe to RSS Feed
- Permalink
- Notify Moderator
You need to understand vectors and ranges.
Try this
- Mark as New
- Bookmark
- Subscribe
- Mute
- Subscribe to RSS Feed
- Permalink
- Notify Moderator
OK, here is a way to make your approach work.
But I would in no way recommend doing so!!
Personally I would prefer a functional solution like in the second sheet I posted and Fred has just posted a similar approach.
You did not like it because you have to use ranges and a table. OK, but is uses a range (just for plotting) and if you need you can easily create a table using the function.
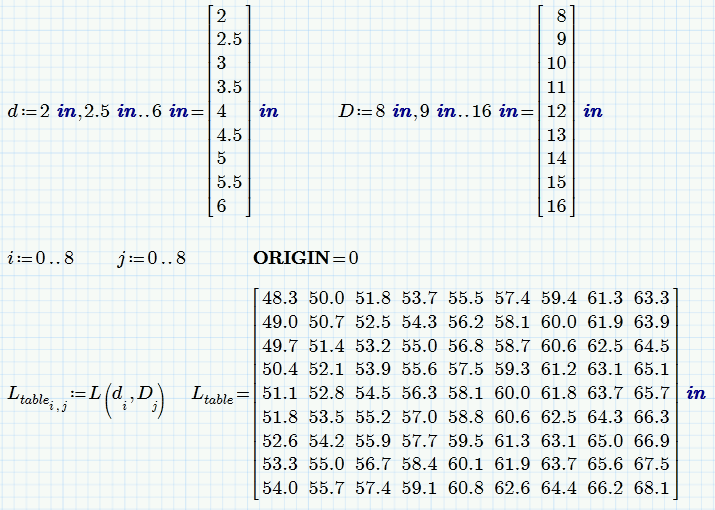
OK - nevertheless here is the solution based on your approach
Basically you begin as you already did to create the table and then, just before the plot you turn the range d into a vector using that undocumented trick.
You may also consider using a different variable for plotting -> dd:=d= So you would use dd in the plot instead of d and d remains a range.

- Mark as New
- Bookmark
- Subscribe
- Mute
- Subscribe to RSS Feed
- Permalink
- Notify Moderator
I thought I had something figured out.
I defined my two range variables and used the trick of immediately making them vectors for plotting purposes.
I used two separate indices to control the matrix generation.
The equation calculates all the correct numbers, but I was expecting a 9x9 matrix.
Why did this create an 81x1 vector instead of a 9x9 matrix ?
Sorry I'm not smart enough to figure this out. Still trying to learn.
Would appreciate any help. Thanks !

- Mark as New
- Bookmark
- Subscribe
- Mute
- Subscribe to RSS Feed
- Permalink
- Notify Moderator
Didn't used to be able to do in-line evaluations. Things aren't always the way they seem

- Mark as New
- Bookmark
- Subscribe
- Mute
- Subscribe to RSS Feed
- Permalink
- Notify Moderator
Thank you Fred !
I feel so stupid that I didn't try that and realize it was actually a 9x9 matrix.
Thanks again, I really appreciate your help !
- Mark as New
- Bookmark
- Subscribe
- Mute
- Subscribe to RSS Feed
- Permalink
- Notify Moderator
Inline evaluations are quite often a tricky thing and something better to avoid.
Make the assignment and then in a separate region do the evaluation.
type L= and you will see that you have a nice 9 x 9 matrix.
- Mark as New
- Bookmark
- Subscribe
- Mute
- Subscribe to RSS Feed
- Permalink
- Notify Moderator
Thank you Werner !
In-line evaluations is a bad habit I've gotten into. Need to stop that, and this is a great lesson to avoid it.
Thanks again, I really appreciate your help !


