Community Tip - Did you get an answer that solved your problem? Please mark it as an Accepted Solution so others with the same problem can find the answer easily. X
- Subscribe to RSS Feed
- Mark Topic as New
- Mark Topic as Read
- Float this Topic for Current User
- Bookmark
- Subscribe
- Mute
- Printer Friendly Page
Plotting cos(y) when -x<y<x
- Mark as New
- Bookmark
- Subscribe
- Mute
- Subscribe to RSS Feed
- Permalink
- Notify Moderator
Plotting cos(y) when -x<y<x
Hello there!
Since I've been around these forums earlier, I've been conviced to work with mathcad prime 3.0!
At the minut I'm doing som old tests, to see what problems i might face.
I faced one! 🙂
I apologize for the language - it's danish.
As you probably already realized, z2 should be going around in a circle - but I have no idea as how I'll make mathcad do that!
I really hope some clever heads in here, can help me out!
Have great day!
Ben
Solved! Go to Solution.
Accepted Solutions
- Mark as New
- Bookmark
- Subscribe
- Mute
- Subscribe to RSS Feed
- Permalink
- Notify Moderator
Since I've been around these forums earlier, I've been conviced to work with mathcad prime 3.0!
Are you convinced about Prime or are you convicted to use it ![]()
Anyway, z1 is a complex scalar and you see the appropriate point in your plot.
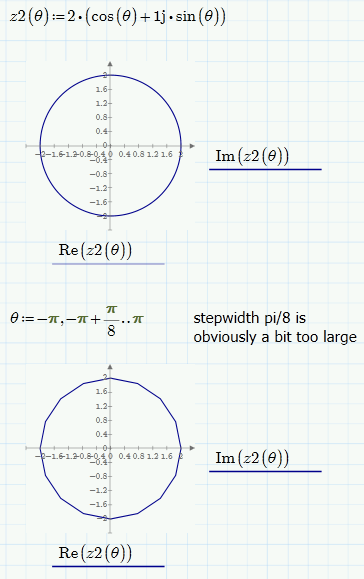
But what did you expect to see if you plot z2? A full circle? Then z2 has to be written as a function of theta. You must not but you can, for better control, define theta as a range variable, running from -pi tp +pi, using an appropriate step width. Of you don't provide a rangevariable you are using Prime's quickplot feature, which means that the range for theta will be from -10 to +10 and (I am not sure but I think) 1000 points are plotted (making a stepwidth of 1/50). That way the circle is drawn over three times which of course is not noticeable here.
The red error is correct as Prime does not know how to calculate z2 without knowing the value of theta and the statement -pi<theta<pi has no relevance nor effect. It would only have an effect if used inside a solve block as constraint, but that has nothing to do with you sheet.
For future questions - please attach the worksheet, not just the pics. And you sure don't have to apologize for your language!
PS: The stepwidth in the pic was chosen large on purpose to show the effect. As we see, a hexadecagon is only a very rough approximation of a circle.

- Mark as New
- Bookmark
- Subscribe
- Mute
- Subscribe to RSS Feed
- Permalink
- Notify Moderator
Thank you so much - again.
Of course it needs to be a function.
I'll remeber to upload the paper next time.
Again - thanks!


