Community Tip - Stay updated on what is happening on the PTC Community by subscribing to PTC Community Announcements. X
- Subscribe to RSS Feed
- Mark Topic as New
- Mark Topic as Read
- Float this Topic for Current User
- Bookmark
- Subscribe
- Mute
- Printer Friendly Page
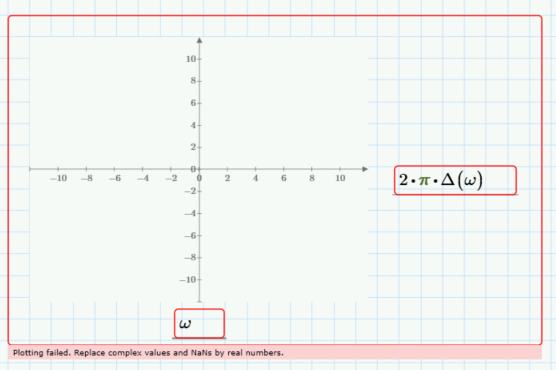
Plotting failed for Dirac Delta (Unit Impulse) Function. Why?
- Mark as New
- Bookmark
- Subscribe
- Mute
- Subscribe to RSS Feed
- Permalink
- Notify Moderator
Plotting failed for Dirac Delta (Unit Impulse) Function. Why?
Hello,
Do I need to define the dirac delta (unit impulse) function separately to be able to use (plot) it?
Mathcad Prime 8 file attached.
Solved! Go to Solution.
- Labels:
-
Calculus_Derivatives
Accepted Solutions
- Mark as New
- Bookmark
- Subscribe
- Mute
- Subscribe to RSS Feed
- Permalink
- Notify Moderator
- Mark as New
- Bookmark
- Subscribe
- Mute
- Subscribe to RSS Feed
- Permalink
- Notify Moderator
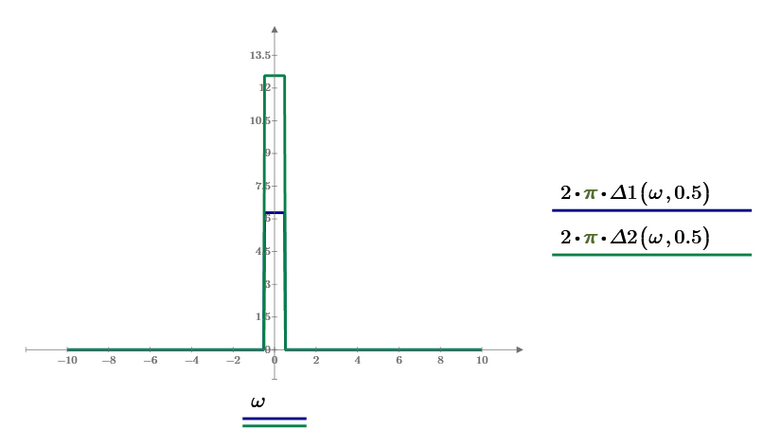
The Dirac impulse has infinite amplitude and infinitesimal width. You can never make a graph of it. You can make some approximations, for example with a rectangular impulse of amplitude 1/ε and width ε so that the area of the impulse is always unitary. with ε small as desired.
- Mark as New
- Bookmark
- Subscribe
- Mute
- Subscribe to RSS Feed
- Permalink
- Notify Moderator
Which is more correct to use between delta1 and delta2 function implementations?
- Mark as New
- Bookmark
- Subscribe
- Mute
- Subscribe to RSS Feed
- Permalink
- Notify Moderator
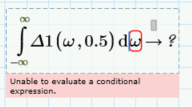
But then...I do not know if I will can evaluate numerically further with this functions defined above.
Which should have the value of 1, right?
- Mark as New
- Bookmark
- Subscribe
- Mute
- Subscribe to RSS Feed
- Permalink
- Notify Moderator
Is it correct to consider like this?
- Mark as New
- Bookmark
- Subscribe
- Mute
- Subscribe to RSS Feed
- Permalink
- Notify Moderator
@ttokoro What function do you use for Dirac (unit impulse)?? Or how do you use Dirac function in Mathcad Prime? Can you show some examples?
- Mark as New
- Bookmark
- Subscribe
- Mute
- Subscribe to RSS Feed
- Permalink
- Notify Moderator
Let's say that I want to plot the fourier transform for cos and sin:
So, this graph:
And this graph:
How can I plot these 2 above graphs in Mathcad Prime 8?
- Mark as New
- Bookmark
- Subscribe
- Mute
- Subscribe to RSS Feed
- Permalink
- Notify Moderator
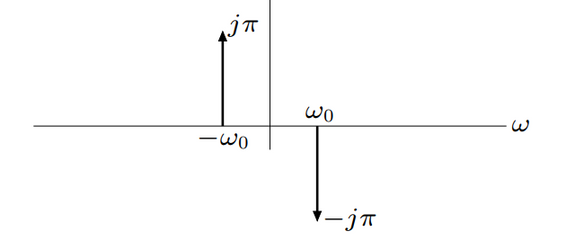
The pulses have infinite amplitude and area p, therefore the infinity symbol is placed on the arrow and the area on one side. For example, see figure. this applies to any Dirac impulse (positive or negative).
Sometimes the Dirac impulse is confused with the unitary impulse which instead is an impulse of amplitude one. It is represented with a dot, and often with a bar that connects it to the abscissa axis and is used in the theory of digital signal processing (see, for example, the attached file).
- Mark as New
- Bookmark
- Subscribe
- Mute
- Subscribe to RSS Feed
- Permalink
- Notify Moderator
Change plot type as below.
- Mark as New
- Bookmark
- Subscribe
- Mute
- Subscribe to RSS Feed
- Permalink
- Notify Moderator
It seems to me that you are confusing the unitary impulse with the Dirac impulse.
- Mark as New
- Bookmark
- Subscribe
- Mute
- Subscribe to RSS Feed
- Permalink
- Notify Moderator
- Mark as New
- Bookmark
- Subscribe
- Mute
- Subscribe to RSS Feed
- Permalink
- Notify Moderator
As MFra already say, it is impossible to plot delta(t).
The only we can do is to make delta(t) as already you make above.
I also do same technique to plot the impulse image om the 2D plot.
- Mark as New
- Bookmark
- Subscribe
- Mute
- Subscribe to RSS Feed
- Permalink
- Notify Moderator


