Community Tip - Did you know you can set a signature that will be added to all your posts? Set it here! X
- Subscribe to RSS Feed
- Mark Topic as New
- Mark Topic as Read
- Float this Topic for Current User
- Bookmark
- Subscribe
- Mute
- Printer Friendly Page
Plotting raw data and function on same set of axes - Mathcad 15
- Mark as New
- Bookmark
- Subscribe
- Mute
- Subscribe to RSS Feed
- Permalink
- Notify Moderator
Plotting raw data and function on same set of axes - Mathcad 15
Hi guys,
I need to plot some raw data (experimental) and a function representing a model on the same set of axes in order to compare accuracy of the model relative to the experimental data. I am able to plot each one on separate axes without any problem, however when I try to add the vector containing the raw data to the y axis of a plot of the function, I get an error that states "the value must be real".
Please advise on how to resolve this.
- Labels:
-
Statistics_Analysis
- Mark as New
- Bookmark
- Subscribe
- Mute
- Subscribe to RSS Feed
- Permalink
- Notify Moderator
Without your worksheet it's hard to guess exactly what goes wrong.
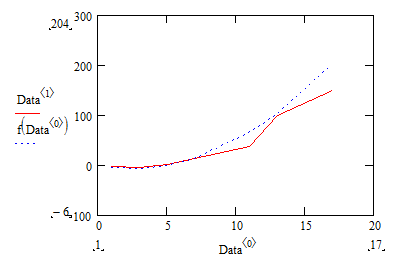
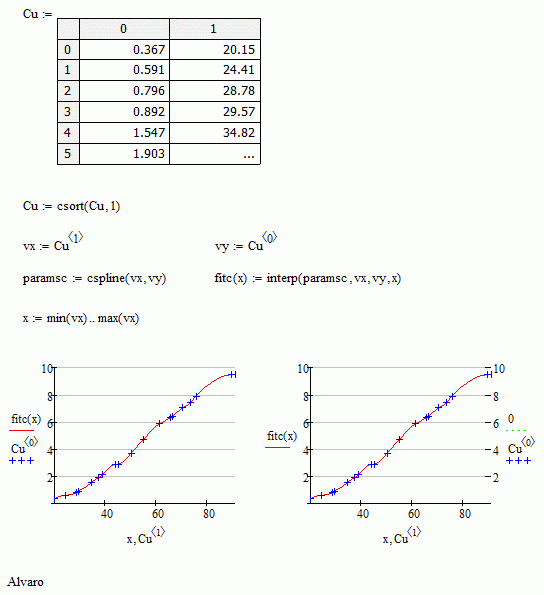
You should either make sure to evaluate your function on each of the experimental (x-axis) points, or use a separate running variable for plotting the function:

Above is the separate running variable. Below uses the x-data points from the data table:

Success!
Luc
- Mark as New
- Bookmark
- Subscribe
- Mute
- Subscribe to RSS Feed
- Permalink
- Notify Moderator
- Mark as New
- Bookmark
- Subscribe
- Mute
- Subscribe to RSS Feed
- Permalink
- Notify Moderator
If you use a new entry on the y-axis it needs a corresponding entry on the x-axis. If ther is none, the last one on the x-axis is used instead.
So from your description I guess you have a function lile f(x) and a vector od y-data values on your y axis. That way you would need an independent variable x (either use quickplot or define x as range) AND a vector of x data values on your x-axis.
An alternative, which was also shown above, is to use only the data value on the x axis, lets say its X, and use Y and f(X) (eventually you need to vectorize that call) on the y axis. You will lose the intermediate values of your function that way, though,as it sill aonly be evaluated at your data points.
BTW, it would have been a good idea if you had attached your worksheet so we would not have to guess what exactly you did wrong.


