Community Tip - You can subscribe to a forum, label or individual post and receive email notifications when someone posts a new topic or reply. Learn more! X
- Subscribe to RSS Feed
- Mark Topic as New
- Mark Topic as Read
- Float this Topic for Current User
- Bookmark
- Subscribe
- Mute
- Printer Friendly Page
Plotting the points of intersection on the graph ?
- Mark as New
- Bookmark
- Subscribe
- Mute
- Subscribe to RSS Feed
- Permalink
- Notify Moderator
Plotting the points of intersection on the graph ?
Hello Everyone.
From :
To the question : Plotting the points of intersection on the graph ?
Thanks in advance for your time and help.
Solved! Go to Solution.
- Labels:
-
Other
Accepted Solutions
- Mark as New
- Bookmark
- Subscribe
- Mute
- Subscribe to RSS Feed
- Permalink
- Notify Moderator
- Mark as New
- Bookmark
- Subscribe
- Mute
- Subscribe to RSS Feed
- Permalink
- Notify Moderator
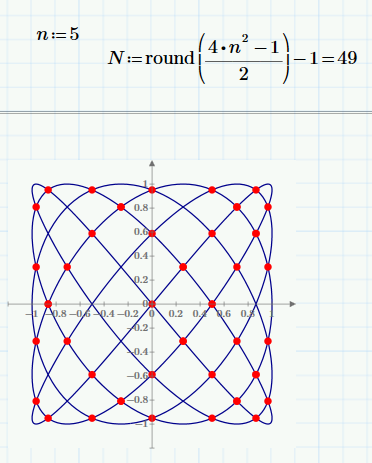
The points where the curve intersects with itself are plotted on the graph.... along with a lot of other points.
If you want the coordinates of the intersection points plotted in readable text next to them, you need to define a few more curves to get them in.
Refer to the great work "Creating amazing images with mathcad" by Byrge Birkeland for ideas on how to do that.
Success!
Luc
- Mark as New
- Bookmark
- Subscribe
- Mute
- Subscribe to RSS Feed
- Permalink
- Notify Moderator
- Mark as New
- Bookmark
- Subscribe
- Mute
- Subscribe to RSS Feed
- Permalink
- Notify Moderator
How many points of intersection on the graph ?
- Mark as New
- Bookmark
- Subscribe
- Mute
- Subscribe to RSS Feed
- Permalink
- Notify Moderator
Sorry, I misunderstood your original question.
To solve the problem at hand, I would mathematically create the lissajous-shape in 3D, then make a projection of it on a (2D) surface and find the intersecting points of it.
Why the detour? because now you only have two expressions, and a single running variable. I see no path where that brings you to more than 2 solutions.
Success!
Luc
- Mark as New
- Bookmark
- Subscribe
- Mute
- Subscribe to RSS Feed
- Permalink
- Notify Moderator
Emperically:

- Mark as New
- Bookmark
- Subscribe
- Mute
- Subscribe to RSS Feed
- Permalink
- Notify Moderator
I greatly appreciate all of your time and help. Werner, Luc, and Fred. ![]()
![]()
![]() . I'm very, very happy. And I think I still need help with the two of question, the above, on cos( ) function :
. I'm very, very happy. And I think I still need help with the two of question, the above, on cos( ) function :
Thanks in advance.
Best Regards.
Loi
- Mark as New
- Bookmark
- Subscribe
- Mute
- Subscribe to RSS Feed
- Permalink
- Notify Moderator
From :
So I have a query : How to rotate a graph (pi/2) clockwise and (pi/2) counter-clockwise ?
Best Regards.
Loi
- Mark as New
- Bookmark
- Subscribe
- Mute
- Subscribe to RSS Feed
- Permalink
- Notify Moderator
> How to rotate a graph (pi/2) clockwise and (pi/2) counter-clockwise ?
clockwise: replace the x(t) on the abscissa by y(t) and the y(t) on the ordinate by -x(t)
counter clockwise: replace the x(t) on the abscissa by -y(t) and the y(t) on the ordinate by x(t)


