Community Tip - If community subscription notifications are filling up your inbox you can set up a daily digest and get all your notifications in a single email. X
- Subscribe to RSS Feed
- Mark Topic as New
- Mark Topic as Read
- Float this Topic for Current User
- Bookmark
- Subscribe
- Mute
- Printer Friendly Page
Points' description
- Mark as New
- Bookmark
- Subscribe
- Mute
- Subscribe to RSS Feed
- Permalink
- Notify Moderator
Points' description
Hi
I am new to the forum so please excuse my lack of knowledge of manners typical of this forum.
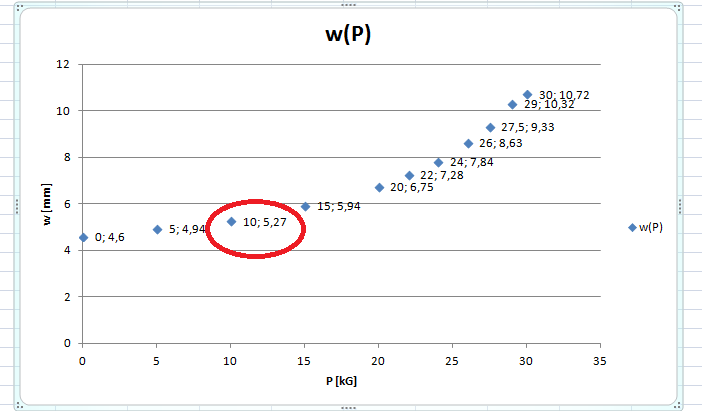
I would like to get points on my plot described, so that next to the point on a plot there is x and y value showed somehow like it is done in, for example, excel:

Is there a possibility to do something similar in MathCad?
I attach my MathCad example.
Than you
Solved! Go to Solution.
- Labels:
-
Other
Accepted Solutions
- Mark as New
- Bookmark
- Subscribe
- Mute
- Subscribe to RSS Feed
- Permalink
- Notify Moderator
Apart from inserting an Excel component, you could do it the hard way: more than 10 years ago Birge Birkelund (?) created a mathcad document showing what amazing images, and text ![]() , you could create in mathcad plots. But that was before PTC took over mathcad and decided that everything had to look and behave differently in a new development called mathcad Prime, which you appear to be using. Up to today, plotting facilities (as well as much of the other functionality) of Prime aren't up to (the old, original) mathcad standards.
, you could create in mathcad plots. But that was before PTC took over mathcad and decided that everything had to look and behave differently in a new development called mathcad Prime, which you appear to be using. Up to today, plotting facilities (as well as much of the other functionality) of Prime aren't up to (the old, original) mathcad standards.
As it happens, a new release of Prime (4.0) is scheduled for the very first next monday (2017-03-06), and one of the announced improvements in there is plotting facilities.....I do not remember this specific feature being on the list though.
Luc
- Mark as New
- Bookmark
- Subscribe
- Mute
- Subscribe to RSS Feed
- Permalink
- Notify Moderator
You can insert Excel component into Mathcad-sheet.
- Mark as New
- Bookmark
- Subscribe
- Mute
- Subscribe to RSS Feed
- Permalink
- Notify Moderator
Apart from inserting an Excel component, you could do it the hard way: more than 10 years ago Birge Birkelund (?) created a mathcad document showing what amazing images, and text ![]() , you could create in mathcad plots. But that was before PTC took over mathcad and decided that everything had to look and behave differently in a new development called mathcad Prime, which you appear to be using. Up to today, plotting facilities (as well as much of the other functionality) of Prime aren't up to (the old, original) mathcad standards.
, you could create in mathcad plots. But that was before PTC took over mathcad and decided that everything had to look and behave differently in a new development called mathcad Prime, which you appear to be using. Up to today, plotting facilities (as well as much of the other functionality) of Prime aren't up to (the old, original) mathcad standards.
As it happens, a new release of Prime (4.0) is scheduled for the very first next monday (2017-03-06), and one of the announced improvements in there is plotting facilities.....I do not remember this specific feature being on the list though.
Luc
- Mark as New
- Bookmark
- Subscribe
- Mute
- Subscribe to RSS Feed
- Permalink
- Notify Moderator
Here is a link for E-book "Сreating Amazing Images with Mathcad 14" by Byrge Birkeland: Creating Amazing Images with Mathcad 14

- Mark as New
- Bookmark
- Subscribe
- Mute
- Subscribe to RSS Feed
- Permalink
- Notify Moderator
As it happens, a new release of Prime (4.0) is scheduled for the very first next monday (2017-03-06), and one of the announced improvements in there is plotting facilities.....I do not remember this specific feature being on the list though.
Unfortunately a while ago they dropped the implementation of the third party plot tool and all other plot enhancements from their list and delayed them for Prime 5 (or 6, or ,.).
- Mark as New
- Bookmark
- Subscribe
- Mute
- Subscribe to RSS Feed
- Permalink
- Notify Moderator
Funny thing is I need fit function other that linear using my data and also need points described. As far as I know Excel offers only linear fit ;(
- Mark as New
- Bookmark
- Subscribe
- Mute
- Subscribe to RSS Feed
- Permalink
- Notify Moderator
Artur Gęśla wrote:
Funny thing is I need fit function other that linear using my data and also need points described. As far as I know Excel offers only linear fit ;(
You may find this interesting: http://www.jkp-ads.com/articles/leastsquares.asp
As was already said, Prime does not offer this feature. In fact, Prime does not even offer a way to name the axis or apply a plot title.
All you could do in Prime is to create a text region for every point you want to apply a description to, type the discription your self and drag the region near the point.
Sure prohibiting.
- Mark as New
- Bookmark
- Subscribe
- Mute
- Subscribe to RSS Feed
- Permalink
- Notify Moderator
Actually, you can use "linfit" to fit non-linear functions.
Attached example. (Apologies to Mathcad users.)


