Community Tip - Stay updated on what is happening on the PTC Community by subscribing to PTC Community Announcements. X
- Subscribe to RSS Feed
- Mark Topic as New
- Mark Topic as Read
- Float this Topic for Current User
- Bookmark
- Subscribe
- Mute
- Printer Friendly Page
Problem with root function
- Mark as New
- Bookmark
- Subscribe
- Mute
- Subscribe to RSS Feed
- Permalink
- Notify Moderator
Problem with root function
Hi,
I'm starting in mathcad and can´t solve a simple problem. I have a function
f(x) = 6.08 - 5.11*x + 1.04*X^2 and I have a matrix with many values of f(x). I would like to create a matrix whose rows are root of equation f(x). I will attached the matrix of f(x).
Thank you
- Mark as New
- Bookmark
- Subscribe
- Mute
- Subscribe to RSS Feed
- Permalink
- Notify Moderator
Not sure what you are asking. f(x) is a quadratic so has exactly 2 roots. What is you table?
- Mark as New
- Bookmark
- Subscribe
- Mute
- Subscribe to RSS Feed
- Permalink
- Notify Moderator
Hi,
I'm just guessing ... that 7_mathcad.TXT file contains f(x) values in its second column and OP wants to get x values related to them.
Martin Hanák
- Mark as New
- Bookmark
- Subscribe
- Mute
- Subscribe to RSS Feed
- Permalink
- Notify Moderator
Why don't you post a Mathcad sheet!!!???
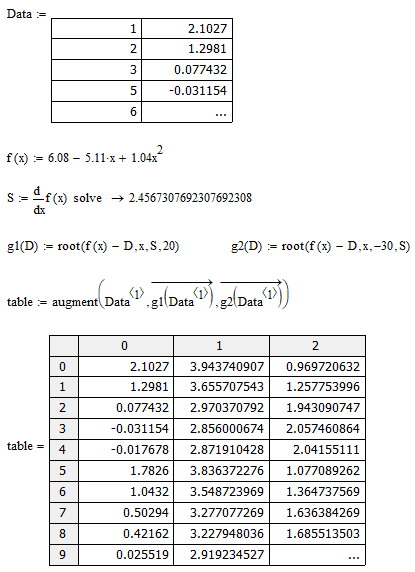
If Martins brave guess is correct, the attached could be a solution
- Mark as New
- Bookmark
- Subscribe
- Mute
- Subscribe to RSS Feed
- Permalink
- Notify Moderator
Thank you rgunwaldsen and MartinHanak for the answers. My explanation was not clear but Werner_E
solve the problem. Werner_E , I didn't post a sheet because I try only for one value of f(x). I have a dought in your worksheet, I didn't understand the variable D.And I have other question, I have many datas to do the same thing, is it possibe to do a function for to this? In other words, the final result is a matrix that each row is a matrix table (of your worksheet)?
- Mark as New
- Bookmark
- Subscribe
- Mute
- Subscribe to RSS Feed
- Permalink
- Notify Moderator
D is only the formal argument of my functions g1 and g2. You can name it anything you like (on both sides of the definitions, of course). You can see D as one of the values in your data list - the ordinate value you would like to know the two abscissa values for. Each function returns one solution of the equation f(x)=D or f(x)-D=0. g1 returns a value to the right of the vertex of the parabola and g2 the solution to the left. In german vertex is "Scheitel", thats the reason I had chose S for the abscissa value of the vertex.
It was necessary to define those functions as its not possible to vectorize the root command itself.
What you demand for multiple data sets should be easy to achieve - as a first step you could turn "table" into a function by simply writing table(Data):=...
The you could call that function with any data you like table(Data2)=..., etc.
Its assumed that in each dataset only the second column contains relevant data.
How to construct the wished for vector of tables depends on how your various data sets would be defined, how they would be represented in Mathcad.
Furthermore, if f(x) changes for every data set, some minor modification had to be done, too.
- Mark as New
- Bookmark
- Subscribe
- Mute
- Subscribe to RSS Feed
- Permalink
- Notify Moderator
As an afterthought:
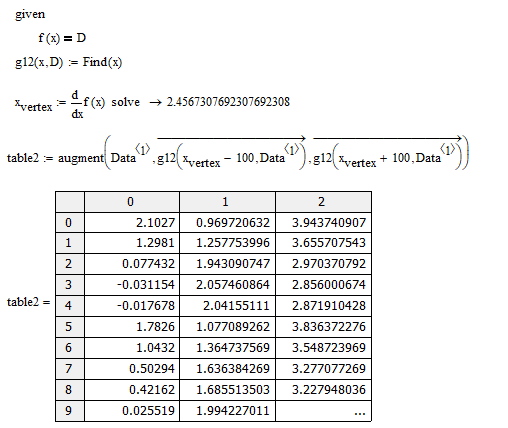
Here is another approach using a numerical solve block:
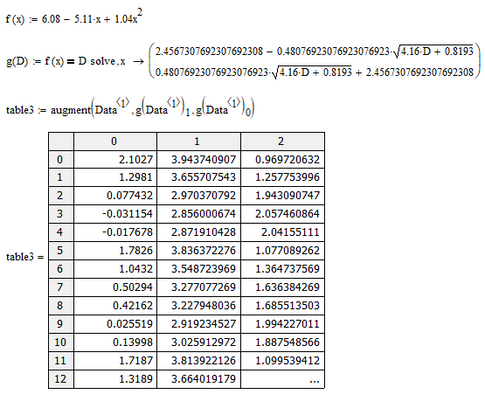
And if your function always is a simple quadratic, its of course easy to solve it symbolically. So the most natural approach could be:
Explicit vectorization is not necessary in this approach, but its not a bad idea to apply it explicitly here, too, for clarity.
- Mark as New
- Bookmark
- Subscribe
- Mute
- Subscribe to RSS Feed
- Permalink
- Notify Moderator
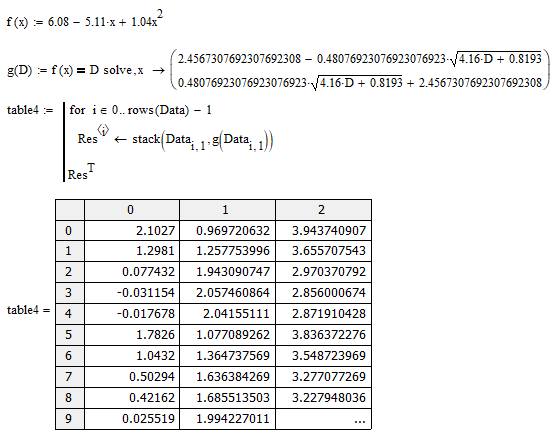
And here is a variant of the last approach which avoids calling g twice for each row:
- Mark as New
- Bookmark
- Subscribe
- Mute
- Subscribe to RSS Feed
- Permalink
- Notify Moderator
May be so


