Community Tip - New to the community? Learn how to post a question and get help from PTC and industry experts! X
- Subscribe to RSS Feed
- Mark Topic as New
- Mark Topic as Read
- Float this Topic for Current User
- Bookmark
- Subscribe
- Mute
- Printer Friendly Page
Residual plot in Mathcad
- Mark as New
- Bookmark
- Subscribe
- Mute
- Subscribe to RSS Feed
- Permalink
- Notify Moderator
Residual plot in Mathcad
Hi.
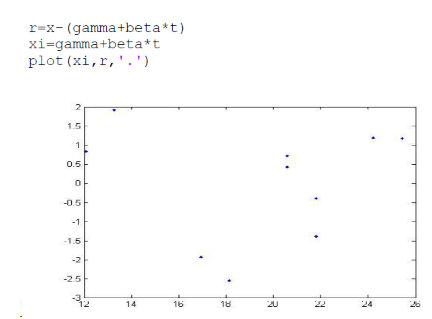
I have this plot in MATLAB:

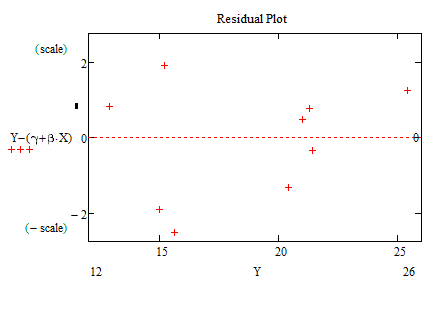
And i have triede to plot the same function in Mathcad:

The points doesn't match. I think the problem is the xi value in the MATLAB code. How do i make exactly the same plot in Mathcad ?.
(x in Matlab is Y in Mathcad) and (t in MATLAB is X in Mathcad)
Solved! Go to Solution.
- Labels:
-
Other
Accepted Solutions
- Mark as New
- Bookmark
- Subscribe
- Mute
- Subscribe to RSS Feed
- Permalink
- Notify Moderator
- Mark as New
- Bookmark
- Subscribe
- Mute
- Subscribe to RSS Feed
- Permalink
- Notify Moderator
Hi Osman,
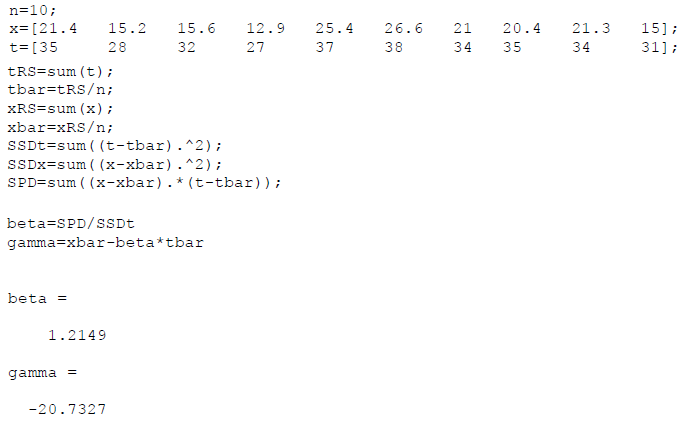
How are defined variables "x", "t", "gamma", "beta" in your MATLAB document?
- Mark as New
- Bookmark
- Subscribe
- Mute
- Subscribe to RSS Feed
- Permalink
- Notify Moderator
Maybe more luck if you attach your Mathcad worksheet here and provide the informations VladimirN has asked for. A pdf-document showing the Matlab code could be an option.
- Mark as New
- Bookmark
- Subscribe
- Mute
- Subscribe to RSS Feed
- Permalink
- Notify Moderator
The MATLAB code:

My Mathcad document is also uploadet.
Thanks in advance
- Mark as New
- Bookmark
- Subscribe
- Mute
- Subscribe to RSS Feed
- Permalink
- Notify Moderator
- Mark as New
- Bookmark
- Subscribe
- Mute
- Subscribe to RSS Feed
- Permalink
- Notify Moderator
Thank you very much. Where was the error ?
- Mark as New
- Bookmark
- Subscribe
- Mute
- Subscribe to RSS Feed
- Permalink
- Notify Moderator
I found it now !. Again, than you very much ![]()
- Mark as New
- Bookmark
- Subscribe
- Mute
- Subscribe to RSS Feed
- Permalink
- Notify Moderator
The Linear regression Graph in the Mathcad document matches exactly with the Linear regression plot in the MATLAB code. The only problem is the residual plot.


