
Turn on suggestions
Auto-suggest helps you quickly narrow down your search results by suggesting possible matches as you type.
Showing results for
Please log in to access translation
Turn on suggestions
Auto-suggest helps you quickly narrow down your search results by suggesting possible matches as you type.
Showing results for
Community Tip - If community subscription notifications are filling up your inbox you can set up a daily digest and get all your notifications in a single email. X
Translate the entire conversation x
Please log in to access translation
Options
- Subscribe to RSS Feed
- Mark Topic as New
- Mark Topic as Read
- Float this Topic for Current User
- Bookmark
- Subscribe
- Mute
- Printer Friendly Page
Residual plot in Mathcad
Jun 06, 2013
11:52 PM
- Mark as New
- Bookmark
- Subscribe
- Mute
- Subscribe to RSS Feed
- Permalink
- Notify Moderator
Please log in to access translation
Jun 06, 2013
11:52 PM
Residual plot in Mathcad
Hi.
I have this plot in MATLAB:
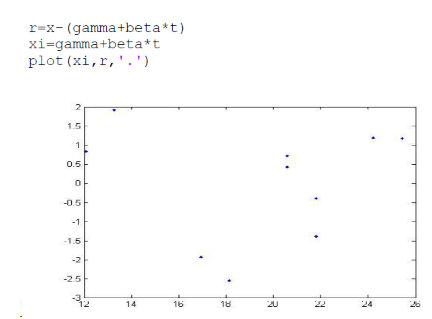
And i have triede to plot the same function in Mathcad:
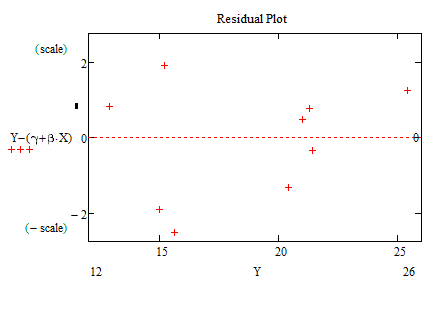
The points doesn't match. I think the problem is the xi value in the MATLAB code. How do i make exactly the same plot in Mathcad ?.
(x in Matlab is Y in Mathcad) and (t in MATLAB is X in Mathcad)
Solved! Go to Solution.
Labels:
- Labels:
-
Other
ACCEPTED SOLUTION
Accepted Solutions
Jun 07, 2013
10:18 AM
- Mark as New
- Bookmark
- Subscribe
- Mute
- Subscribe to RSS Feed
- Permalink
- Notify Moderator
Please log in to access translation
7 REPLIES 7
Jun 07, 2013
05:12 AM
- Mark as New
- Bookmark
- Subscribe
- Mute
- Subscribe to RSS Feed
- Permalink
- Notify Moderator
Please log in to access translation
Jun 07, 2013
05:12 AM
Hi Osman,
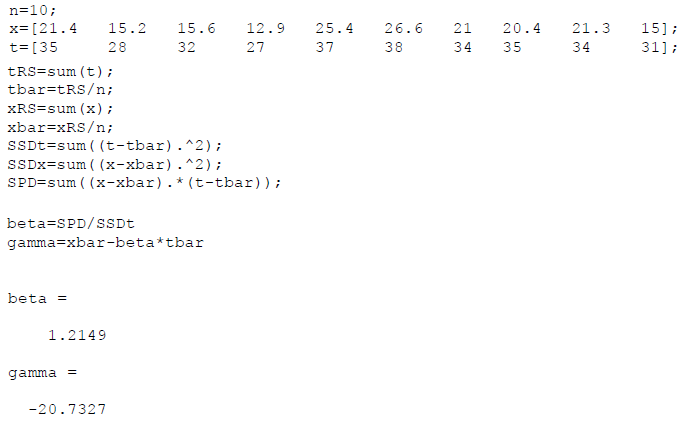
How are defined variables "x", "t", "gamma", "beta" in your MATLAB document?
Jun 07, 2013
07:34 AM
- Mark as New
- Bookmark
- Subscribe
- Mute
- Subscribe to RSS Feed
- Permalink
- Notify Moderator
Please log in to access translation
Jun 07, 2013
07:34 AM
Maybe more luck if you attach your Mathcad worksheet here and provide the informations VladimirN has asked for. A pdf-document showing the Matlab code could be an option.
Jun 07, 2013
09:17 AM
- Mark as New
- Bookmark
- Subscribe
- Mute
- Subscribe to RSS Feed
- Permalink
- Notify Moderator
Please log in to access translation
Jun 07, 2013
09:17 AM
The MATLAB code:
My Mathcad document is also uploadet.
Thanks in advance
Jun 07, 2013
10:18 AM
- Mark as New
- Bookmark
- Subscribe
- Mute
- Subscribe to RSS Feed
- Permalink
- Notify Moderator
Please log in to access translation
Jun 07, 2013
10:21 AM
- Mark as New
- Bookmark
- Subscribe
- Mute
- Subscribe to RSS Feed
- Permalink
- Notify Moderator
Please log in to access translation
Jun 07, 2013
10:21 AM
Thank you very much. Where was the error ?
Jun 07, 2013
10:26 AM
- Mark as New
- Bookmark
- Subscribe
- Mute
- Subscribe to RSS Feed
- Permalink
- Notify Moderator
Please log in to access translation
Jun 07, 2013
10:26 AM
I found it now !. Again, than you very much 
Jun 07, 2013
09:19 AM
- Mark as New
- Bookmark
- Subscribe
- Mute
- Subscribe to RSS Feed
- Permalink
- Notify Moderator
Please log in to access translation
Jun 07, 2013
09:19 AM
The Linear regression Graph in the Mathcad document matches exactly with the Linear regression plot in the MATLAB code. The only problem is the residual plot.


