Community Tip - Did you get called away in the middle of writing a post? Don't worry you can find your unfinished post later in the Drafts section of your profile page. X
- Subscribe to RSS Feed
- Mark Topic as New
- Mark Topic as Read
- Float this Topic for Current User
- Bookmark
- Subscribe
- Mute
- Printer Friendly Page
Rotation Tilt and Twist . . .and two lines trapped in a matrix
- Mark as New
- Bookmark
- Subscribe
- Mute
- Subscribe to RSS Feed
- Permalink
- Notify Moderator
Rotation Tilt and Twist . . .and two lines trapped in a matrix
Here are the two lines . . .2x + 4y -2z = 0 and . . .3x + 5y = 1
the augmented matrix that I defined as M . . .M:=.[2 4 -2 0 ]
[3 5 0 1 ] not able to put the whole thing into one bracket of course
and using the rref (reduced row echelon form) Mathcad command . . .Mrref = [1 0 5 2]
[0 1 -3 -1]
It took me some time to to learn how to put lines like this into a three dimensional plot and them watch them intersect. At forst I found myself looking at what appeared to be one squigly line bending around and shooting off at awkward angles. Then I learned how to use the rotation tilt and twist commands until the lines I was expecting to see occured in the box and looked exactly like the graphs you might see in any calculus or linear algebra text. Ya know . . .the three little pitcures that shoe "exactly one solution" "no solution" and "infinitely many solutions". In this case there are infinite solutions. And you might quickly see the algebraic solution . . .
x = 2 - 5t
y = -1 +3t
z = t
where t is a parameter used to represent the non leading variable z and can be any real number. On previous occasion (you can expolre my posts by clicking on my avatar) I have made profound advances in mathematics (for me any way) by first understanding the rotating, twisting and tilting is more than just trying to get a better view. When the box (the matrix) is manipulated so that two lines become only one line and that line only gets longer or shorter which dependes upon the length of the two lines (that you can no longer "see') there should be (as was the case with me) en explosion in understanding vectors and linear dependence. So any way plot this matrix and put the rotation at 90 degrees, twist 90 degrees and tilt 90 degrees. You should see one line comming from the left at a slight downward angle with what appears to be two identical (I am tempted to use the word symetrical) right angles at each end. A little help here? I want all of this to turn into one line, a line we will call t, and it should appear just like the ones in a text labled "infinately many solutions. thanks.
Solved! Go to Solution.
- Labels:
-
Calculus_Derivatives
Accepted Solutions
- Mark as New
- Bookmark
- Subscribe
- Mute
- Subscribe to RSS Feed
- Permalink
- Notify Moderator
I am sure Valery will answer your questions concerning his usage of matrices and rank.
In the meantime I think I have to clarify things (hopefilly) concerning the 3D-plots.
To begin with - I was cheating concerning one of your two planes.
But lets begin with how to do 3D-plots and I concentrate on two analytical ways omitting the usage of createmesh and plotting of matrices.
Mathcad has a nice feature: You define a function in the two parameters x and y which returns the z-value of a point and if you provide Mathcads 3D-graph with only the function name it will (quick)plot the surface. By default x and y a running from -5 to 5 in 20 steps, but you can change this in the format menu. You Can add more functions by typing a "," after the first function name and then the next name.
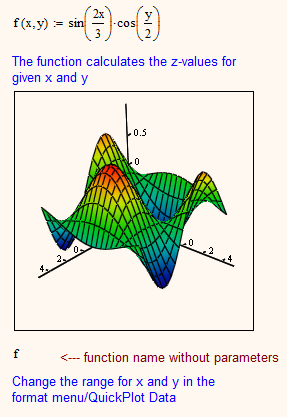
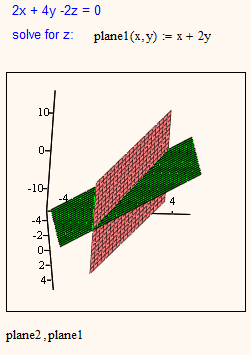
Valery and myself have chosen that feature to plot our planes. We let the symbolic processor solve the equation for z, assign the result to a function (z0(x,y) e.g.) and put that name (z0) in the placeholder of the 3Dplot.
Unfortunately this method will not work for one of your two planes (3x+5y=1). Obviously we cannot solve that equation for z as z is missing. This means the plane is vertical, perpendicular to the xy-plane or in other words, its parallel to the z-axis. We have a similar problem now as in a 2D-plot when we want to plot a vertical line - it doesnt work the way it works for any other nonvertical straight line.
But mathcad provides different ways to plot 3D-graphs and one is using the parameter form of the surface. A good example was given to you by Stuart when you asked how to plot spheres two months ago (http://communities.ptc.com/message/195210#195210). We can define a function with two parameters (I will call them a and b for typing simplicity) which returns a 3-dimensional vector, representing the x,y,z-coordinates of a point in 3D. Again you feed Mathcads 3D-graph with the function name and it will plot it for you. This time you do not have that much control over the x- and y-range, as the appropriate setting in the Format menu would apply to the parameters a and b!
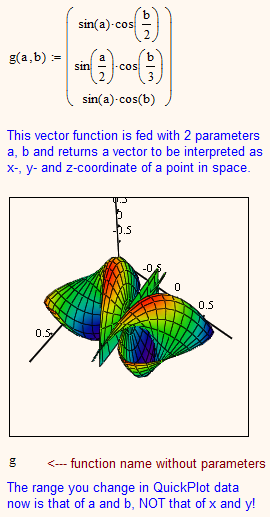
This was the method I used to plot your vertical plane. I chose a to be the x-coordinate, y is calculated according to the equation you provided and z was set to parameter b, being any arbitrary value.
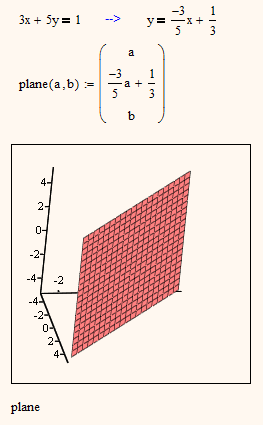
Of course you can mix those ways of plotting a surface and that way I plotted your two planes - each one in another way:
I don't know why, but I am not able to include pictures in this post - I am getting an error everytime I try (Is it only me or has anybody an idea what the cause can be? The errormessage is only [null] - not helpful)
Anyway, I try to attach the four images - hope that at least this will work.
EDIT: Thats crazy. I opened a new reply, copied the text of my first in and now I was able to include pictures.
Could it be that I am not allowed to add pix if I edit an already posted reply? I am sure I have done that may times before, though.
Anyway, I will delete the first posting of mine if this one shows up correct after AddReply.
- Mark as New
- Bookmark
- Subscribe
- Mute
- Subscribe to RSS Feed
- Permalink
- Notify Moderator
roger wells wrote:
Here are the two lines . . .2x + 4y -2z = 0 and . . .3x + 5y = 1
The first one is definitely not a line but a plane in 3D space!
Ya know . . .the three little pitcures that shoe "exactly one solution" "no solution" and "infinitely many solutions".
Obviously you are intersecting two planes in 3D and I would be very surprised by the "exact one solution" case.
If you are after the intersection of two straight lines in 2D, why not doing it in a 2D plot?
Is that lengthy posting really a question (it is flagged as such)? If yes, you might consider a shorter reformulation and an attached worksheet which shows the problem you are facing.
- Mark as New
- Bookmark
- Subscribe
- Mute
- Subscribe to RSS Feed
- Permalink
- Notify Moderator
hmm . . .the planes and not lines. Looks like I have some more work to do. And I did graph the solution set
f(x) := 2 - 5x
g(x) := 3x - 1
h(x) := x
Probably ought to mention that I only have mathcad 2000 and also do not have internet access.
All three lines where plotted onto the 2d plane. If those three lines where planes, then the line I am looking for (the parameter t) is a straight line pointing directly at me and all I can see is a single point.
As far as the "lengthy posting" and "flagged question" part of you answer goes . . .I suppose I would compare the entire thing to a "rant" that you might see on a political blog site, The difference of course is the rigorous logic and exact mathematical language. That is what brings me back to this site. Other math discussion groups (like yahoo answers) are filled with homework problems. I prefer a serious (and moderated) discussion that is specific to mathcad software and those trying to master the challenge. I have been able to solve many problems on this site so far.
Peace.
- Mark as New
- Bookmark
- Subscribe
- Mute
- Subscribe to RSS Feed
- Permalink
- Notify Moderator
Also . . .Werner I did not say I am looking for "one exact solution". In this case the solution set has an infinite number of solutions. Am correct in my expectation of how this graph will eventualy look like? One single line in 3d space.
- Mark as New
- Bookmark
- Subscribe
- Mute
- Subscribe to RSS Feed
- Permalink
- Notify Moderator
Okay . . .
In a 3D plot my X axis range is 0 . . .1
Z axis range is 0 . . .4
Y axis range is 0 . . .3
The format is fill contour and alternate mesh.
Rotation 350 degrees
Tilt 25 degrees
Twist 350 degrees
I have selectes surface plot with points.
That is the best I can do so far.
Ultimately I am expecting either 3 coincident planes or 3 planes intersecting in a line. That My question would be . . .
Can anyone plot these planes and post them here not in a Mathcad document. I dont know how you cats do that but I have several other examples from before. I need to be able to view them on a library computer (without mcd software). It would be very helpful.
- Mark as New
- Bookmark
- Subscribe
- Mute
- Subscribe to RSS Feed
- Permalink
- Notify Moderator
I suppose I would compare the entire thing to a "rant" that you might see on a political blog site,
I was asking as I was (and still be) not sure if there is someone asking for help.
So for whatever its worth:
"2x + 4y -2z = 0 and 3x + 5y = 1" seemed to be two linear equations in 3D and so graphically two planes.
The three euqations x = 2 - 5t, y = -1 +3t and z = t you mentioned form the equations of the line of intersection in paremtric (t) form. The equations you mentioned in your last post f(x) := 2 - 5x, g(x) := 3x - 1, h(x) := x are just three lines in 2D space - quite different.
Here are your two planes
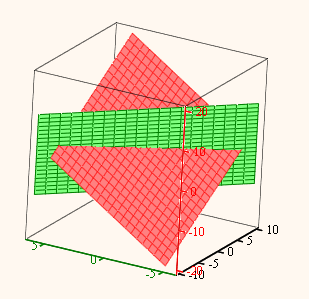
Below two additional examples
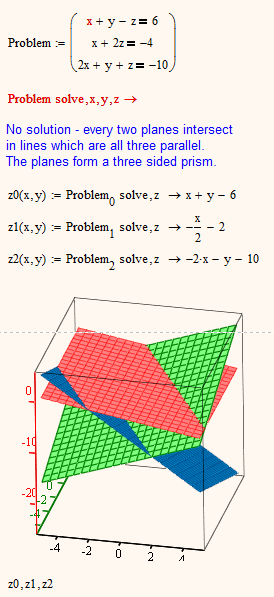
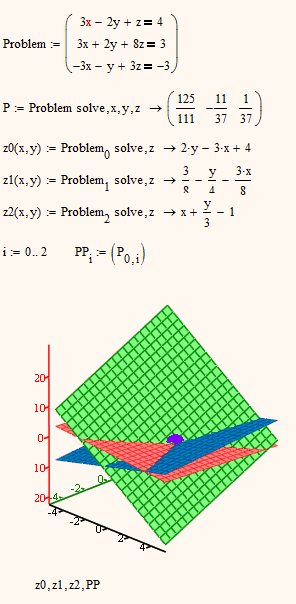
- Mark as New
- Bookmark
- Subscribe
- Mute
- Subscribe to RSS Feed
- Permalink
- Notify Moderator

- Mark as New
- Bookmark
- Subscribe
- Mute
- Subscribe to RSS Feed
- Permalink
- Notify Moderator
Same problem with your way to plot his plane 3x+5y=1 😉
- Mark as New
- Bookmark
- Subscribe
- Mute
- Subscribe to RSS Feed
- Permalink
- Notify Moderator
It is the picture #3 from the article "Mathematical education and mathematical programs" (Open Education Magazine)
See please
- Mark as New
- Bookmark
- Subscribe
- Mute
- Subscribe to RSS Feed
- Permalink
- Notify Moderator
The point of my remark was, that the method you and myself had chosen to plot the planes does not work for planes which appear as straight lines seen from above (don't know if they are called first-projecting as in German, guess no). That means, that this method, while convenient, is not general enough . Same problem if you try to create a worksheet to deal with all sort of two equations with two variables - extra treatment necessary for vertical lines.
I resorted to parametric representation to create the first pic I posted which showed the two planes of the original posters first posting.
- Mark as New
- Bookmark
- Subscribe
- Mute
- Subscribe to RSS Feed
- Permalink
- Notify Moderator
3D Plot rotation on thr Mathcad Server
- Mark as New
- Bookmark
- Subscribe
- Mute
- Subscribe to RSS Feed
- Permalink
- Notify Moderator
Maybe nice, but has nothing to do with what we were talking about, isn't it?
You cannot plot that specific plane with that sheet either!
- Mark as New
- Bookmark
- Subscribe
- Mute
- Subscribe to RSS Feed
- Permalink
- Notify Moderator
This is actualy the one I was looking at when I messaged you, and I see now that Werner has posted the two planes. Using your example (and I basicly am copying right of the page hoping everything matches) my worksheet now includes
A*x =B (thats A*x evaluate numericly B)
A:= [2 4 -2]
[3 5 0]
B:= [0]
[1]
A1:= augment (A,B) A1 = [2 4 -2 0]
[3 5 0 1]
I think all of that is just another way of putting the original coefficient matrix into reduced row echelon form, using the identity matrix B. In my first post (on this subject) you can see I simply used the rref command and named that matrix T. None the less I am following through and . . .
rank(A) = 2 rank(A1) = 2 length(B) = 2
rank(A) =(evaluate numericly) rank(A1) = 1
rank(A) < rank(B) = 0
At this point I am guilty of code plagarism scince I really dont know what the purpose of a line like "rank A is less that rank B equals zero. (I know a matrix has a rank) Next comes the three equations z1,z2 and z3. In this problem I am solving only two linear equations in three variables and the problem of yours (the one I am trying to copy) . . .its three equations. So would there only be z1 and z2? Also, after the evaluate numericly B subscript 0 I can not get sollve,z right arrow to work. Did you just use the symbolic solve command and fill in the placeholder or what? What I am hoping for is to complete thes last two lines of code z1 and z2 insert a 3D plot and put z1,z2 in the placeholder (just like you did and get a graph the looks like the one Werner posted. You dig?
- Mark as New
- Bookmark
- Subscribe
- Mute
- Subscribe to RSS Feed
- Permalink
- Notify Moderator
I am sure Valery will answer your questions concerning his usage of matrices and rank.
In the meantime I think I have to clarify things (hopefilly) concerning the 3D-plots.
To begin with - I was cheating concerning one of your two planes.
But lets begin with how to do 3D-plots and I concentrate on two analytical ways omitting the usage of createmesh and plotting of matrices.
Mathcad has a nice feature: You define a function in the two parameters x and y which returns the z-value of a point and if you provide Mathcads 3D-graph with only the function name it will (quick)plot the surface. By default x and y a running from -5 to 5 in 20 steps, but you can change this in the format menu. You Can add more functions by typing a "," after the first function name and then the next name.

Valery and myself have chosen that feature to plot our planes. We let the symbolic processor solve the equation for z, assign the result to a function (z0(x,y) e.g.) and put that name (z0) in the placeholder of the 3Dplot.
Unfortunately this method will not work for one of your two planes (3x+5y=1). Obviously we cannot solve that equation for z as z is missing. This means the plane is vertical, perpendicular to the xy-plane or in other words, its parallel to the z-axis. We have a similar problem now as in a 2D-plot when we want to plot a vertical line - it doesnt work the way it works for any other nonvertical straight line.
But mathcad provides different ways to plot 3D-graphs and one is using the parameter form of the surface. A good example was given to you by Stuart when you asked how to plot spheres two months ago (http://communities.ptc.com/message/195210#195210). We can define a function with two parameters (I will call them a and b for typing simplicity) which returns a 3-dimensional vector, representing the x,y,z-coordinates of a point in 3D. Again you feed Mathcads 3D-graph with the function name and it will plot it for you. This time you do not have that much control over the x- and y-range, as the appropriate setting in the Format menu would apply to the parameters a and b!

This was the method I used to plot your vertical plane. I chose a to be the x-coordinate, y is calculated according to the equation you provided and z was set to parameter b, being any arbitrary value.

Of course you can mix those ways of plotting a surface and that way I plotted your two planes - each one in another way:

I don't know why, but I am not able to include pictures in this post - I am getting an error everytime I try (Is it only me or has anybody an idea what the cause can be? The errormessage is only [null] - not helpful)
Anyway, I try to attach the four images - hope that at least this will work.
EDIT: Thats crazy. I opened a new reply, copied the text of my first in and now I was able to include pictures.
Could it be that I am not allowed to add pix if I edit an already posted reply? I am sure I have done that may times before, though.
Anyway, I will delete the first posting of mine if this one shows up correct after AddReply.
- Mark as New
- Bookmark
- Subscribe
- Mute
- Subscribe to RSS Feed
- Permalink
- Notify Moderator
I will never understand how you mathematicians and engineer types can get to such and advanced level where this stuff comes so naturally. I am a pretty big fan of mathcad and I have used all the others like Wolfram, Mathematica, Maple and all of the Texas Instruments products. With Mathcad I am mostly proficient at integrating, differentiating, single and multi variable calculus problems. It was very helpful in algebra and trigonometry also. The graphing in 2D is fantastically easy to master. Thanks again for these graphs (you and Vallery)
- Mark as New
- Bookmark
- Subscribe
- Mute
- Subscribe to RSS Feed
- Permalink
- Notify Moderator
I see what you mean about the one of those equations being "vertical and paralell" to the z axis. It looks like you have solved that issue in the same way we implicity graph a vertical line on a 2D plot (by switching the axis around) making the dependant variable the abscissa and the independent variable the ordinate. Apparently I am suppose to choose a correct answer so that the rules of this discussion board are kept intact. I gotta go with this post because I understand it better. You and Werner are at a way to advanced level for me but both have been very helpful.
peace.
- Mark as New
- Bookmark
- Subscribe
- Mute
- Subscribe to RSS Feed
- Permalink
- Notify Moderator
About this three plots:
http://en.wikipedia.org/wiki/Rouch%C3%A9%E2%80%93Capelli_theorem
- Mark as New
- Bookmark
- Subscribe
- Mute
- Subscribe to RSS Feed
- Permalink
- Notify Moderator
You guy are moving way to fast for me and I believe I have my answer to whatever my question was. Now I gotta go back accros the river fire up my computer and explore this info. Werner THANKS! I am not the mathematician that you are and wll need some time to explore all that. Valery . . .did not expect a response so quickly . . .I just finished adding code to my worksheet based on our correspondence a few months ago.
A*x = B (thats A times x (evaluate numericly) B
A:= [2 4 -2]
[3 5 0 ]
B := [0 ]
[1]
I am sure you can see the implied matrix when I can only use microsoft word here.
A1 := augment (A,B)
A1 = [2 4 -2 0]
[3 5 0 1]
Its this "rank" command that I am struggling with and also the use of subscripts. You are apperently describing an XYZ plane using equations that I am frustratingly close to understanding.
Relax . . .you and Werner . . .Ill get this.
- Mark as New
- Bookmark
- Subscribe
- Mute
- Subscribe to RSS Feed
- Permalink
- Notify Moderator
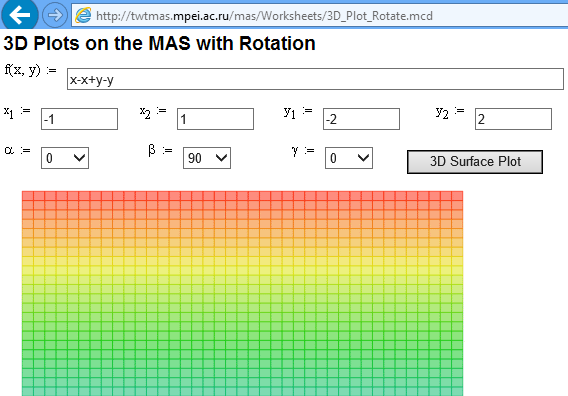
A vertical Plane
- Mark as New
- Bookmark
- Subscribe
- Mute
- Subscribe to RSS Feed
- Permalink
- Notify Moderator
Valery Ochkov wrote:
A vertical Plane
![]() Sorry, but thats a horizontal plane (z=0). So we see, its all a matter of the point of view.
Sorry, but thats a horizontal plane (z=0). So we see, its all a matter of the point of view. ![]()
BTW, I think that online sheet of yours would be enhanced greatly if axes where included in the plot. And I don't speak of those silly and often confusing scales Mathcad includes in 3D-plots but the real axes which intersect in (0,0,0).
- Mark as New
- Bookmark
- Subscribe
- Mute
- Subscribe to RSS Feed
- Permalink
- Notify Moderator
Well I took some time off from all of this but I believe my planes have been plotted in 3d on mathcad 2000. Here are the commands. . .
3x + 4y = (evaluate numericly) a
(-3/5)x + 1/3 = (evaluate numericly)b
I now define a 1column 3 row matrix and call it plane1
[ a ]
[ -2a + b]
[ b ]
At first there where data points but I formated the plot with fill surface, smooth shading and a beautiful green.
Now I went to work on the second plane . . .
2x + 4y -2z = (evaluate numericly) a
-2y + z = (evaluate numericly) b
calling it plane2 . . .I define another 1X3 matrix and fill in the placeholders . . .
[ a ]
[ -2a + 1 ]
[ b ]
With wire frame, no fill and stunning pink.
In the 3D plot placeholders I entered Plane1,Plane2 . . .and pow! there they are! Now I am prepared to use rotate, tilt and twist to explore. It doesnt take long to get the two planes into a position to see that they clearly cross right through each other. Now I no the are pretty elementary linear algebra equations, but getting them plotted onto a math software program was my goal. Now that I am able to do this I am in a better position to post questions about the system, which as you recall from my original post was . . .
2x + 4y - 2z = 0
3x + 5y = 1
Looking at my "finished" plot I now find myself wondering if this is the correct plot of those two planes. Remember one of these plots is for a vertical plane where you set "z to a arbritary paramater b". My graph looks alot like your first one (the red one) but the second plane (the green one) does not seem similiar as it apears to cross through at a much more awkward angle. If you have the interest I would apreciate any input on that final thought.
- Mark as New
- Bookmark
- Subscribe
- Mute
- Subscribe to RSS Feed
- Permalink
- Notify Moderator
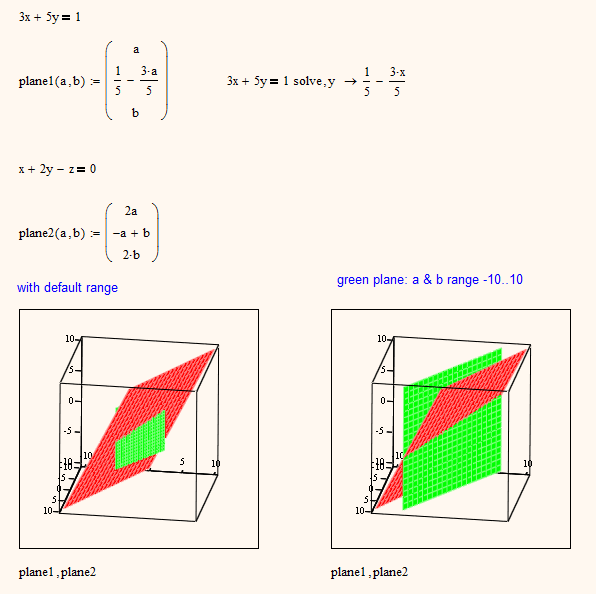
OK, as you like the parametric approach - lets go. You made both planes perpendicular to the xy-plane, which at least the second one is not. I don't understand how you would arrive at the parametric representation you have shown. Following is the way I would do.
First plane: 3x+5y=1.
Our goal is a 3x1 vector with a parametric representation, which would of course mean we have to use two parameters (lets say a and b) to calculate the three vector elements. A parametric representation is not unique, there is an infinite number of them to chose from, so we will chose the most convenient one.
The equation for our plane does not include z, so its convenient to set z=b and then we will find a way to express x and y using parameter a alone. Its convenient to set x=a and if we solve our euqation for y we get y=-3/5x+1/5 which means y=-3/5a+1/5.
So one possible representation is
[ a ]
[ -3/5a+1/5 ] no idea how you arrive at -2a+b here
[ b ]
another one would be
[ -5/3*a+1/3 ]
[ a ]
[ b ]
and there are many more, all would represent the same plane. What part of the infinite plane you see in the Mathcad plot and how fine the grid is would depend upon the range of a and b which you can set in the diagram format menu (Quickplot data, Range1 & Range2, default is -5..5, grid:20).
Second plane: x+2y-z=0 (already simplified by dividing by 2)
One possible way is to set x=a, y=b and then calculate z=x+2y, that is z=a+2b
So we have
[ a ]
[ b ]
[ a+2b ]
other possibilities are
[ a ] [ 2a ]
[ -a/2+b/2 ] or [ -a+b ] no idea how you arrive at -2a+1 here
[ b ] [ 2b ]
or
[ -2a+b ]
[ a ]
[ b ]
- Mark as New
- Bookmark
- Subscribe
- Mute
- Subscribe to RSS Feed
- Permalink
- Notify Moderator
Well good morning, and thankyou for your time and help on all of this. First I can answer where the 2a + b came from. It was suppose to read -3/5 a + 1/3. amd even with that I see you are suggesting -3/5a + 1/5. So even my mistake was wrong. But what you have just posted is very clear to me and I will certainly have fun with all this new info.
Peace.


