- Subscribe to RSS Feed
- Mark Topic as New
- Mark Topic as Read
- Float this Topic for Current User
- Bookmark
- Subscribe
- Mute
- Printer Friendly Page
Some dumb questions about Classic Mathcad usage
- Mark as New
- Bookmark
- Subscribe
- Mute
- Subscribe to RSS Feed
- Permalink
- Notify Moderator
Some dumb questions about Classic Mathcad usage
hi,
I've forgotten how to work with data in classic mathcad. I have the questions in the file attached along with the data file. These are the three questions, for the sake of the post:
1) how to get x,y data into a function
2) how to assign units to the data
3) how to curve fit the data
The questions would apply to any x,y data set. This happens to be a fan pq curve.
Thanks,
Anthony
Solved! Go to Solution.
- Labels:
-
Mathcad Usage
Accepted Solutions
- Mark as New
- Bookmark
- Subscribe
- Mute
- Subscribe to RSS Feed
- Permalink
- Notify Moderator
you've already defined your units; to assign them to the variables, simply multiply
Curve fitting is a whole 'nother art. Shown is a seventh order polynomial
- Mark as New
- Bookmark
- Subscribe
- Mute
- Subscribe to RSS Feed
- Permalink
- Notify Moderator
you've already defined your units; to assign them to the variables, simply multiply
Curve fitting is a whole 'nother art. Shown is a seventh order polynomial
- Mark as New
- Bookmark
- Subscribe
- Mute
- Subscribe to RSS Feed
- Permalink
- Notify Moderator
thanks fred,
that reminded me on how to answer the first two questions. i ended up doing it in a spreadsheet though, since it was easier. i don't need to curve fit the data. i added that question in there because it seemed like a logical step people might be interested in.
- Mark as New
- Bookmark
- Subscribe
- Mute
- Subscribe to RSS Feed
- Permalink
- Notify Moderator
i ended up having to do something similar to what i was trying to do before. this time it worked. not sure what i was doing wrong before. but attached was the basic issue. i had models from data and models from functions. i was trying to plot them in the same plot and couldn't. i ended up exporting the data and plotting it in a spreadsheet. this time, i could get the plot to work in mathcad. kinda weird.
anyways, if this helps anyone, i attached the file. i wouldn't put too much weight into the math. that's a work in progress. the main thing is trying to plot two different mathcad data types. i was thinking i would have to convert the matrices into a function. but i guess that's not necessary.
i'm still not sure how you could do that, even if you wanted to. right now the file has the matrices as is and the functions as is. there is no converting of either data.
i should state this is a mathcad 15 file. same as my previous attachment.
Edit; forgot to attach the data file
- Mark as New
- Bookmark
- Subscribe
- Mute
- Subscribe to RSS Feed
- Permalink
- Notify Moderator
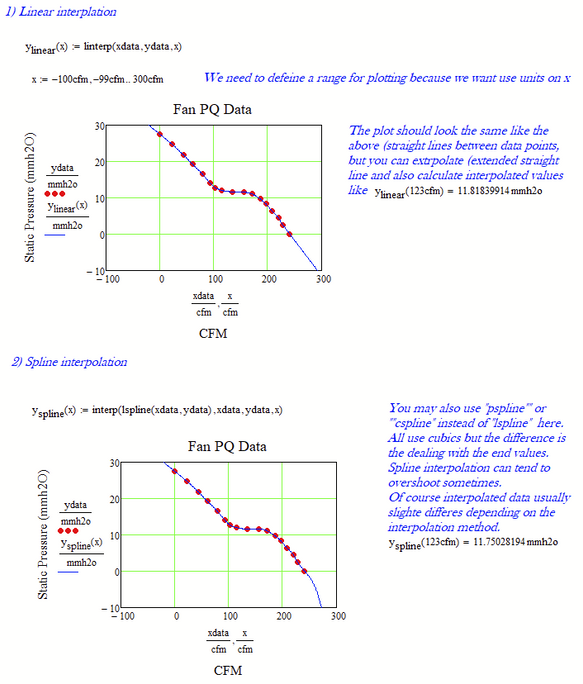
You could "convert the matrices into a function" by using either linear or spline interpolation, but as you wrote thats not necessary if you just want to plot the data.
- Mark as New
- Bookmark
- Subscribe
- Mute
- Subscribe to RSS Feed
- Permalink
- Notify Moderator
ah, thanks werner
the problem with curve fits of the data in a spreadsheet was it didn't get the last point right. you could force the first point to match but the last point would be off. i'm assuming mathcad would have the same issue.
yesterday i had two formulas and one set of data. when i tried to plot it in mathcad it wasn't working. but i think it was my fault. not sure. but i think i got the hang of it now. i use mathcad so little that i completely forget how to use it. i was looking in the manual and couldn't find anything to help. sometimes it's hard to find the right thing in the manual, even though it's in there somewhere.
- Mark as New
- Bookmark
- Subscribe
- Mute
- Subscribe to RSS Feed
- Permalink
- Notify Moderator
I wasn't talking of a curve fit but of a curve interpolation. Mathcad provides functions for linear interpolation and for interpolation with cubic splines. So the data points are connected either by straight lines (with the very same optical result like when you simply plot one vector over the other) or by a cubic.
But again - if you are just after plotting and are not in need for interpolated data, plotting one vector over the other is just fine.
MC15 sheet attached
- Mark as New
- Bookmark
- Subscribe
- Mute
- Subscribe to RSS Feed
- Permalink
- Notify Moderator
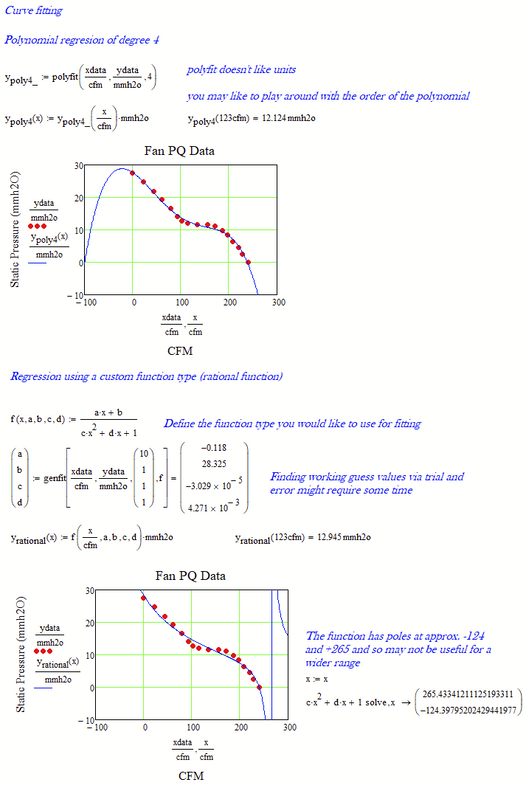
AS opposed to interpolation, a fit function (regression) normally does not run through a single data point exactly but just approximates them. It may require some experience and knowledge about the process the data stems from to decide for a suitable function type.
Here are just two examples of how you can do it in Mathcad:
- Mark as New
- Bookmark
- Subscribe
- Mute
- Subscribe to RSS Feed
- Permalink
- Notify Moderator
oh nice,
yeah, the linear interpolation looks good. thanks for also clarifying about curve fitting.
anthony


