Community Tip - Stay updated on what is happening on the PTC Community by subscribing to PTC Community Announcements. X
- Subscribe to RSS Feed
- Mark Topic as New
- Mark Topic as Read
- Float this Topic for Current User
- Bookmark
- Subscribe
- Mute
- Printer Friendly Page
Stack of Element of matrix
- Mark as New
- Bookmark
- Subscribe
- Mute
- Subscribe to RSS Feed
- Permalink
- Notify Moderator
Stack of Element of matrix
Dear all
1.When i substitute all variables results of y(i,x) matrix in matrix and hard to plot, How can plot y(i,x) ?
2.After I can not do 1 above I try to manual by stack but Results still Matrix in matrix,Can we automatic stack the element of matrix y(i,x) (red circle in attachment) ?
3.Or you can revise my technique to better and easy?
thank you
Solved! Go to Solution.
Accepted Solutions
- Mark as New
- Bookmark
- Subscribe
- Mute
- Subscribe to RSS Feed
- Permalink
- Notify Moderator
Here is a variant that tries to suppress the vertical line segments between the parabolic segments.
- Mark as New
- Bookmark
- Subscribe
- Mute
- Subscribe to RSS Feed
- Permalink
- Notify Moderator
Hi,
There are predefined functions stack() and augment().
Look them up in help as they are pretty self explanatory.
Cheers
Terry
- Mark as New
- Bookmark
- Subscribe
- Mute
- Subscribe to RSS Feed
- Permalink
- Notify Moderator
Can you plot the function y(i,x) ? Without user input one by one
- Mark as New
- Bookmark
- Subscribe
- Mute
- Subscribe to RSS Feed
- Permalink
- Notify Moderator
1) What you get are not pure vectors or matrices because you mix ranges (i) and vectors
2)a) Whats the reason for defining vectors with three times the same value
2)b) What kind of plot do you expect with all values being the same?
3) It looks to me that you are not aware the when you define
you are already defining a nested vector
- Mark as New
- Bookmark
- Subscribe
- Mute
- Subscribe to RSS Feed
- Permalink
- Notify Moderator
Dear Werner_E
After I remove i (iteration) it still be nest matrix.
My purpose i wanna construct Parabolic Equation continue (n metric) y=a(x-h)^2+k in single matrix and then we can do matrix operation.
Thank you
- Mark as New
- Bookmark
- Subscribe
- Mute
- Subscribe to RSS Feed
- Permalink
- Notify Moderator
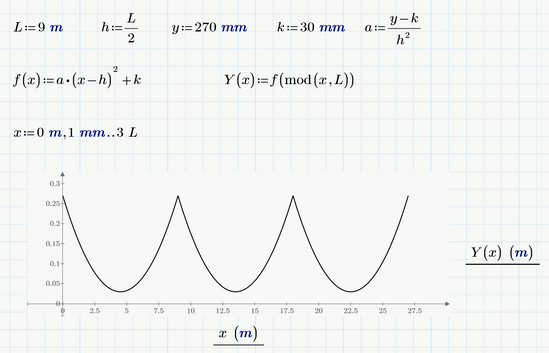
Not sure, but if the goal is to plot a periodic function, you may use the "mod" function to do the job:
Prime 6 sheet attached
- Mark as New
- Bookmark
- Subscribe
- Mute
- Subscribe to RSS Feed
- Permalink
- Notify Moderator
Thank u Werner_E
But L have different length L1#L2#L3#...#Ln
- Mark as New
- Bookmark
- Subscribe
- Mute
- Subscribe to RSS Feed
- Permalink
- Notify Moderator
Your L-values were all the same in your initial sheet!
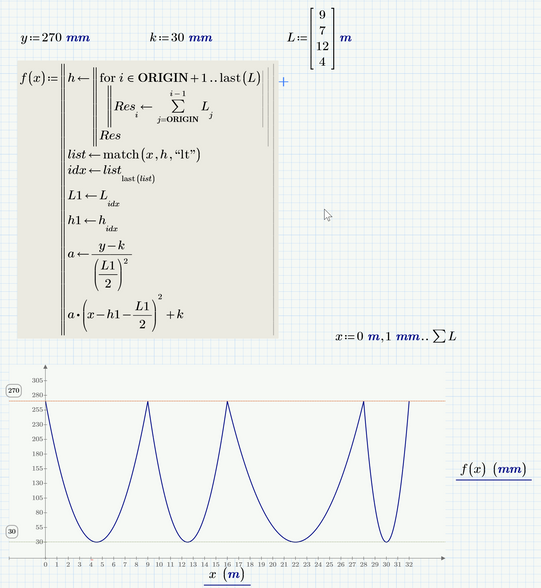
Maybe something like the attached could help?
Personally I prefer programs and functions over vectors and ranges on worksheet level.
Prime 6 sheet attached
- Mark as New
- Bookmark
- Subscribe
- Mute
- Subscribe to RSS Feed
- Permalink
- Notify Moderator
Thank u
it relate to L,t,y1,x1,k,h are matrices
I will test your sheet i will return ask more if not working
Thank you for your help
- Mark as New
- Bookmark
- Subscribe
- Mute
- Subscribe to RSS Feed
- Permalink
- Notify Moderator
You never used "t" in your initial sheet.
Furthermore - if you wanted to work with individual and different values of "y" and "k" for each parabola, you should have used different values in the first place.
My program assumes the same upper and lower values (y and k) for each parabola, but the program could be easily adapted - you simply would use "idx" to chose the correct value for each parabola.
- Mark as New
- Bookmark
- Subscribe
- Mute
- Subscribe to RSS Feed
- Permalink
- Notify Moderator
Please Could you do for me? Werner
Thank you
- Mark as New
- Bookmark
- Subscribe
- Mute
- Subscribe to RSS Feed
- Permalink
- Notify Moderator
- Mark as New
- Bookmark
- Subscribe
- Mute
- Subscribe to RSS Feed
- Permalink
- Notify Moderator
Here is a variant that tries to suppress the vertical line segments between the parabolic segments.
- Mark as New
- Bookmark
- Subscribe
- Mute
- Subscribe to RSS Feed
- Permalink
- Notify Moderator
I try to add matrix x and h but not working
- Mark as New
- Bookmark
- Subscribe
- Mute
- Subscribe to RSS Feed
- Permalink
- Notify Moderator
.) Your modified function is constant as the argument x (of f(x)) is never used. So the graph would be a horizontal line.
.) Not sure but it looks to me that the plot area is a bit higher than the definition of the range x
.) defining the range x for plotting overwrites the three element vector x you defined at the top. I have no idea what you think that this vector is supposed to do.
.) you again have vectors with all the same values. For testing purposes you should use different values if this is mandatory, otherwise use a simple variable with the one and only value.
.) your vector h does not make any sense, just use L1/2 in the program. Didn't you notice the the first step in the program creates a vector h? This will overwrite your vector h anyway!


