Community Tip - Stay updated on what is happening on the PTC Community by subscribing to PTC Community Announcements. X
- Subscribe to RSS Feed
- Mark Topic as New
- Mark Topic as Read
- Float this Topic for Current User
- Bookmark
- Subscribe
- Mute
- Printer Friendly Page
System of Equations Mathcad Prime 7 - result returned is too large to display
- Mark as New
- Bookmark
- Subscribe
- Mute
- Subscribe to RSS Feed
- Permalink
- Notify Moderator
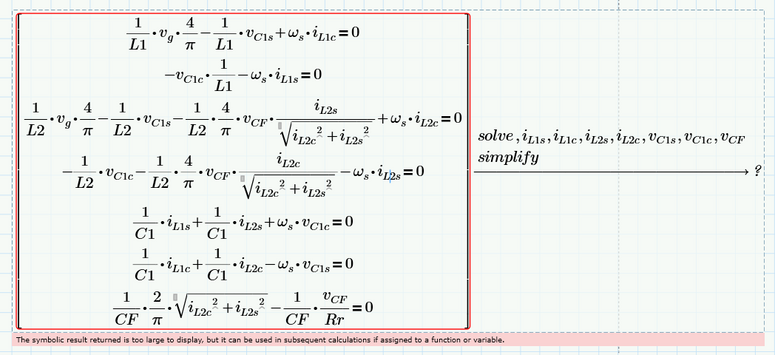
System of Equations Mathcad Prime 7 - result returned is too large to display
- Mark as New
- Bookmark
- Subscribe
- Mute
- Subscribe to RSS Feed
- Permalink
- Notify Moderator
@Werner_E @ttokoro @LucMeekes
What else also I see is that:
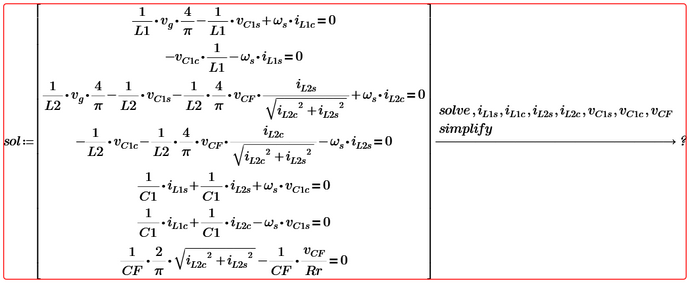
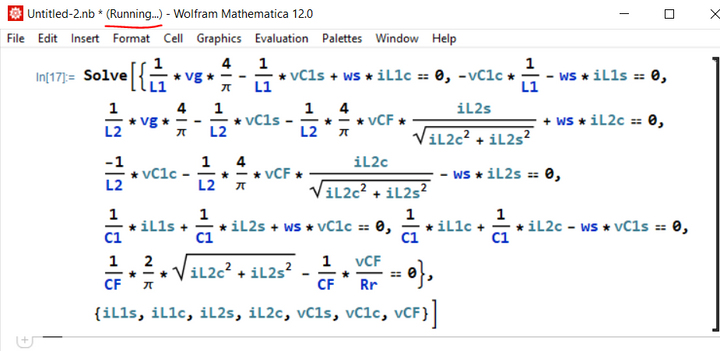
I introduced this system of equations to be solved (for curiosity) in both Maple and Mathematica, and the results look something like this:
Mathematica still thinks, thinks, and also thinks for some good minutes..and I think it will run endlessly...
(in the end, I aborted the calculation by myself...)
Maple:
See attached pdf.
And if you look more closely:
But at least Maple shows the results of the system of equations, while Mathematica doesn't really want to (or at least it needs to be helped somehow).
What do you think about this?
- Mark as New
- Bookmark
- Subscribe
- Mute
- Subscribe to RSS Feed
- Permalink
- Notify Moderator
Here are the results from Maple Flow...
P.S.: In Maple Flow, for the time being, there is no symbol for the constant pi, but you have to put Pi...
And so on.
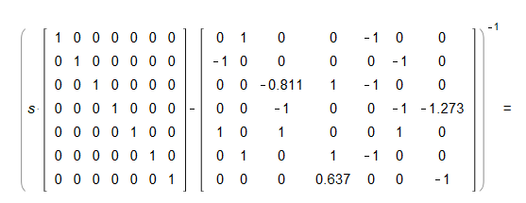
Mathematica Result of that inverse (I attached again the pdf):
Mathcad Prime 8 result of that inverse matrix:
Mathcad 11 result of that inverse matrix:
Seems to be something funny here:
Mathcad Prime 8 and Maple Flow/Maple give similar results relative to the calculation of the inverse of that matrix s*Identity(7)-Aa, while Mathcad 11 and Mathematica give similar results when calculating the same matrix inverse, if I correctly draw the conclusions from these results.
@Werner_E @ttokoro @LucMeekes what do you say?
- Mark as New
- Bookmark
- Subscribe
- Mute
- Subscribe to RSS Feed
- Permalink
- Notify Moderator
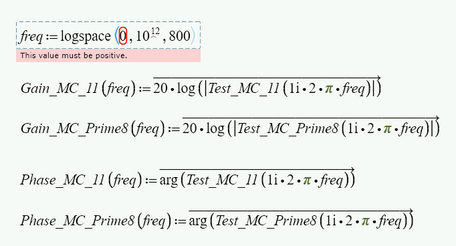
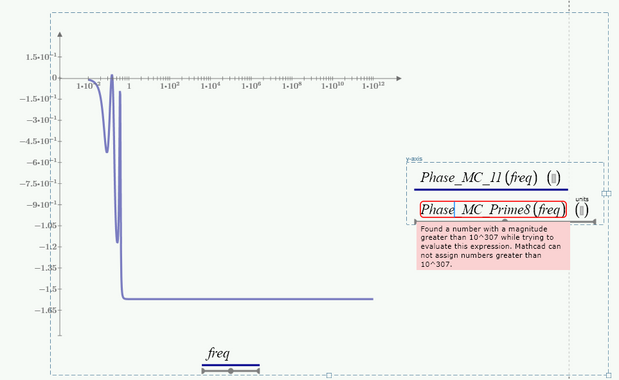
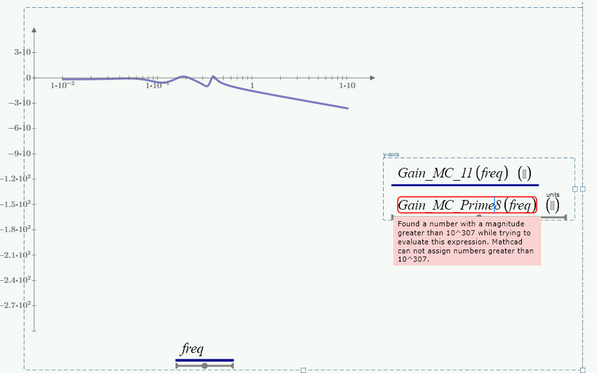
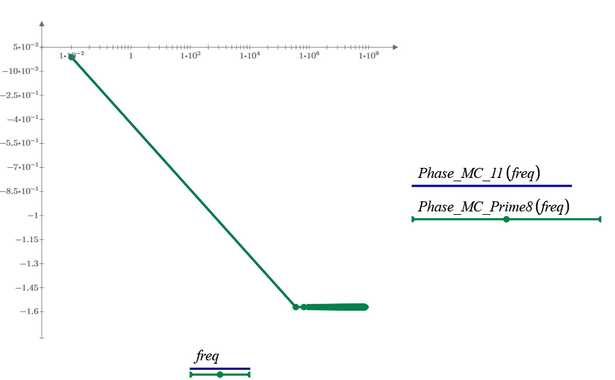
Here, if I don't set freq=logpsace(0,...,...) then the graph of Test_MC_Prime8 doesn't work (see the figure below)
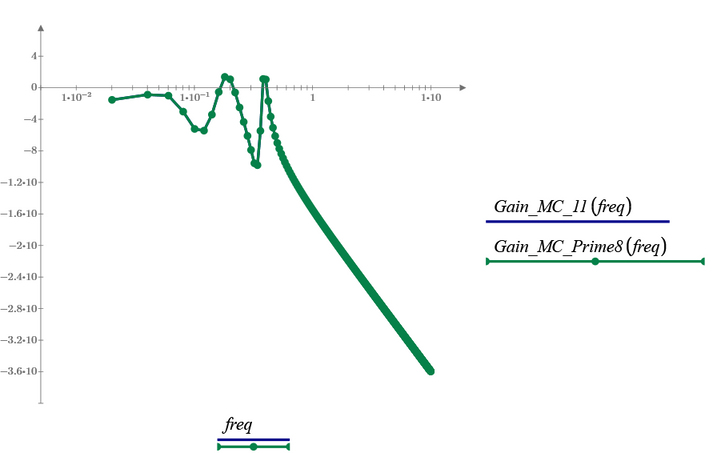
Here in the graph above the freq is from 0Hz to 10Hz, otherwise if I put from 0Hz to, for example, 10^12Hz it doesn't work.
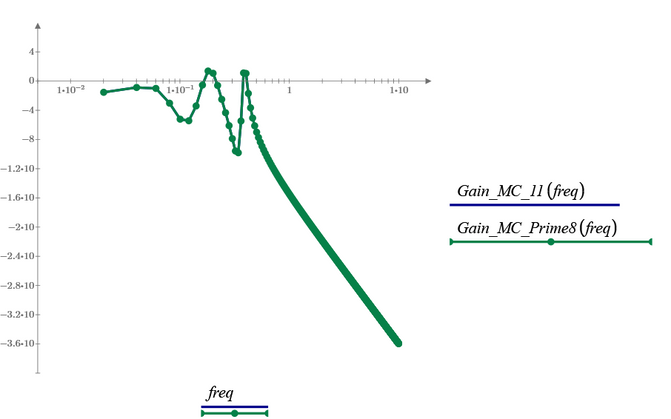
So, otherwise, it seems that they are the same, although they have very different degrees of the powers of s in the denominator and the numerator of the 2 fractions.
Another thing:
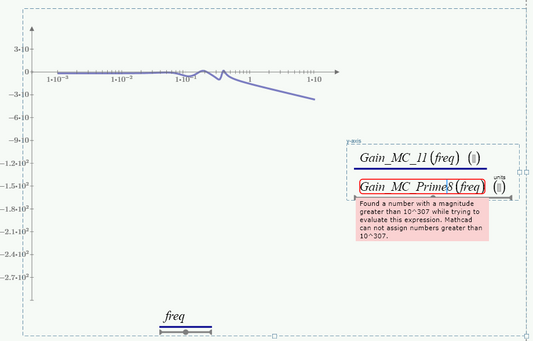
For example, this way I can plot with freq starting from 0 Hz, but if I change it to start from 10^-3 Hz, for example, then Test_MC_Prime8 (the function with a high degree) then I can no longer plot the Test_MC_Prime8 function...
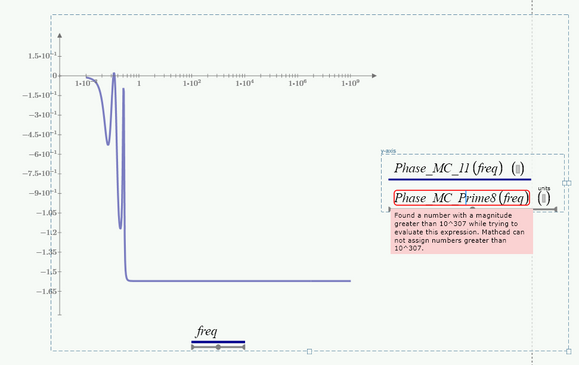
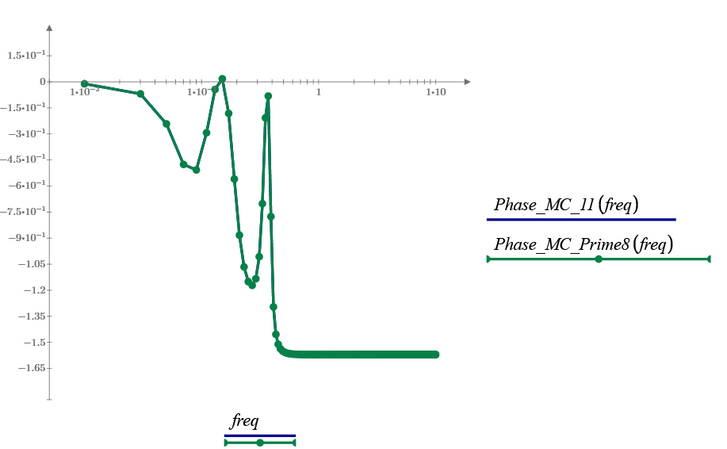
And if I remove the freq expression (freq=logspace(...)) altogether and let him plot freq on the graph as he knows, then it seems to be ok
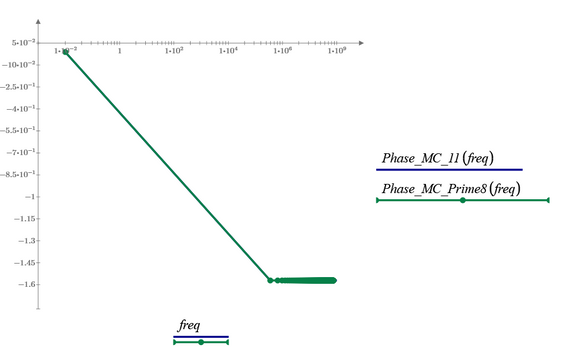
With freq from 10^-3 to 10 for the phase
Then, should I trust the result from Mathcad 11 and Mathematica or from Mathcad Prime 8 and Maple Flow/Maple, relative to the 2 expressions with very different powers in the numerator and denominator...?
With Mathcad Prime I will go further…because it will be at my disposal for this moment more than Mathcad 11, Mathematica or Maple..
Mathcad Prime 8 file attached.
- Mark as New
- Bookmark
- Subscribe
- Mute
- Subscribe to RSS Feed
- Permalink
- Notify Moderator
At first glance, some remarks:
You cannot plot 0 (Hz or whatever) on a log scale, since log(0) is undefined.
You second plot, where freq apparently is not defined, Prime chooses linearly spaced points from start to end, Since you maximum value in the range is large (10^9), it starts at 0.01, and steps with close to 10^6...
With log plots, you (yourself) should be in control of the plot range. So you should use the logspace function, or another one that chooses well spaced absissa points.
I generally use something like:
which gives me logarithmically spaced points from s to e with p points per decade, such as:
Success!
Luc
- Mark as New
- Bookmark
- Subscribe
- Mute
- Subscribe to RSS Feed
- Permalink
- Notify Moderator
"Instead of transposing the matrix and deleting the second row and first column in the transposed matrix, I don't transpose but instead set the first ROW and second COLUMN to zero with the exception of the common element."
Do you have any bibliographic references where this method of calculating minors can be found?
It seems quite interesting, that's why I would like to know where you found it or how you found it..
- Mark as New
- Bookmark
- Subscribe
- Mute
- Subscribe to RSS Feed
- Permalink
- Notify Moderator
Sorry, I can't give you any reference, I simply knew this.
And if you look at how the determinant of a matrix can be calculated (Laplace expansion, https://en.wikipedia.org/wiki/Laplace_expansion) it should be clear why the method I implemented give the correct result with the benefit of returning the correct sign automatically.
According the bode plot I finally succeeded in finding the file (usually I don't keep the various files from this forum where I played around here an there, I attach it.
You asked in various of your posting what we think about the different results from Prime, Maple, Flow and Mathematica. Actually I am getting to confused as of your different and on first sight unrelated questions. So I had not looked in detail at the various pdfs and pics. But I am beginning to understand why Prime refuses to display these huge expressions 😉
But seriously its quite clear, that Prime has the least capable symbolic engine compared to all the other programs you have at hand.
- « Previous
-
- 1
- 2
- Next »

