
Turn on suggestions
Auto-suggest helps you quickly narrow down your search results by suggesting possible matches as you type.
Showing results for
Please log in to access translation
Turn on suggestions
Auto-suggest helps you quickly narrow down your search results by suggesting possible matches as you type.
Showing results for
Community Tip - Learn all about PTC Community Badges. Engage with PTC and see how many you can earn! X
Translate the entire conversation x
Please log in to access translation
Options
- Subscribe to RSS Feed
- Mark Topic as New
- Mark Topic as Read
- Float this Topic for Current User
- Bookmark
- Subscribe
- Mute
- Printer Friendly Page
Table of results
Aug 12, 2014
08:07 AM
- Mark as New
- Bookmark
- Subscribe
- Mute
- Subscribe to RSS Feed
- Permalink
- Notify Moderator
Please log in to access translation
Aug 12, 2014
08:07 AM
Table of results
I have a fairly complex formula for I(q,x) and I want to tabulate the results with q values (1 - 5) as the columns and x values (1 to 5) as the rows. I've no doubt it's very easy, but I can't see how to do it.
I apologize if I've posted this question to the wrong forum.
Solved! Go to Solution.
Labels:
- Labels:
-
Other
ACCEPTED SOLUTION
Accepted Solutions
Aug 12, 2014
05:25 PM
- Mark as New
- Bookmark
- Subscribe
- Mute
- Subscribe to RSS Feed
- Permalink
- Notify Moderator
Please log in to access translation
Aug 12, 2014
05:25 PM
JOHN WOODGATE wrote:
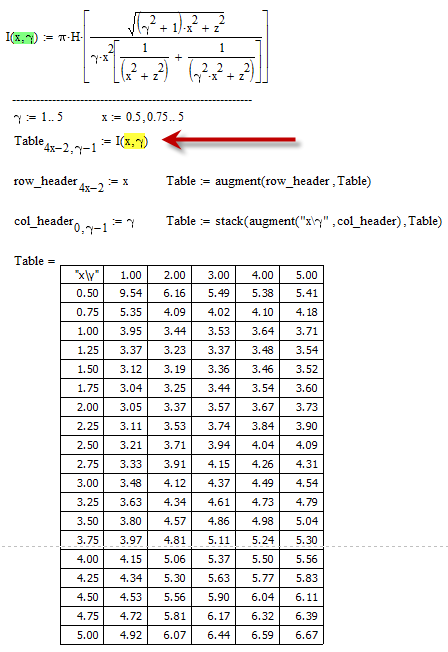
Well. I copied your script into mine, with strange results. The graphs are correct, I belive (I can check with the inverted equation, which should always give H = 0.4). But the tabled values are mostly not correct, and those that are, may be coincidence. Anyway, I've attached my worksheet for your appraisal.
The reason is that you have to switch the arguments of I(), either when you define I() or when you call it.
In your very first post you said you had a function I(q,x) and want a table with x (which is the second argument of the function) as rows. So my solutions took this for granted.
In your sheet you have defined I(x,gamma) and obviously you want a table with x (which is now the first argument of the function) as rows. So of course you have to switch the order of the arguments to get it right.
If you would use my last approach, you wouldn't need the auxiliary function for the very same reason either.
14 REPLIES 14
Aug 12, 2014
08:09 AM
- Mark as New
- Bookmark
- Subscribe
- Mute
- Subscribe to RSS Feed
- Permalink
- Notify Moderator
Please log in to access translation
Aug 12, 2014
08:09 AM
There is probably a number of different ways to achieve this.
Could you post an example?
Aug 12, 2014
09:12 AM
- Mark as New
- Bookmark
- Subscribe
- Mute
- Subscribe to RSS Feed
- Permalink
- Notify Moderator
Please log in to access translation
Aug 12, 2014
09:12 AM
Thanks for prompt response. Here is the output table from Excel. I have to show that Mathcad gives the same numbers. x in my original message is B in the Excel sheet.
| q | 1 | 2 | 3 | 4 | 5 |
| B | |||||
| 0.5 | 9.54 | 6.16 | 5.49 | 5.38 | 5.41 |
| 0.75 | 5.35 | 4.09 | 4.02 | 4.10 | 4.18 |
| 1 | 3.95 | 3.44 | 3.53 | 3.64 | 3.71 |
| 1.25 | 3.37 | 3.23 | 3.37 | 3.48 | 3.54 |
| 1.5 | 3.12 | 3.19 | 3.36 | 3.46 | 3.52 |
| 1.75 | 3.04 | 3.25 | 3.44 | 3.54 | 3.60 |
| 2 | 3.05 | 3.37 | 3.57 | 3.67 | 3.73 |
| 2.25 | 3.11 | 3.53 | 3.74 | 3.84 | 3.90 |
| 2.5 | 3.21 | 3.71 | 3.94 | 4.04 | 4.09 |
| 2.75 | 3.33 | 3.91 | 4.15 | 4.26 | 4.31 |
| 3 | 3.48 | 4.12 | 4.37 | 4.49 | 4.54 |
| 3.25 | 3.63 | 4.34 | 4.61 | 4.73 | 4.79 |
| 3.5 | 3.80 | 4.57 | 4.86 | 4.98 | 5.04 |
| 3.75 | 3.97 | 4.81 | 5.11 | 5.24 | 5.30 |
| 4 | 4.15 | 5.06 | 5.37 | 5.50 | 5.56 |
| 4.25 | 4.34 | 5.30 | 5.63 | 5.77 | 5.83 |
| 4.5 | 4.53 | 5.56 | 5.90 | 6.04 | 6.11 |
| 4.75 | 4.72 | 5.81 | 6.17 | 6.32 | 6.39 |
| 5 | 4.92 | 6.07 | 6.44 | 6.59 | 6.67 |
Aug 12, 2014
09:19 AM
- Mark as New
- Bookmark
- Subscribe
- Mute
- Subscribe to RSS Feed
- Permalink
- Notify Moderator
Please log in to access translation
Aug 12, 2014
09:19 AM
Based on the information provided Werners example should do the trick.
Live data is much more productive to work BTW.
Aug 12, 2014
09:40 AM
- Mark as New
- Bookmark
- Subscribe
- Mute
- Subscribe to RSS Feed
- Permalink
- Notify Moderator
Please log in to access translation
Aug 12, 2014
09:40 AM
Mike Armstrong wrote:
Based on the information provided Werners example should do the trick.
I would be a bit more tricky concerning the indices as the stepwidth of x (B) is not 1. But of course it could be done (see below). We may even add row and column headers, as long as we are working without units.
Nevertheless I would suggest to provide the values of x and q as vectors and invest in a utility routine which creates the table. This routine would have four arguments: the function name, vector of row values, vector of column values and a flag indicating if row/columns headers should be created.
Aug 12, 2014
11:28 AM
- Mark as New
- Bookmark
- Subscribe
- Mute
- Subscribe to RSS Feed
- Permalink
- Notify Moderator
Please log in to access translation
Aug 12, 2014
11:28 AM
Thank you. I don't understand your reference to 'live data'. Do you mean that I shoudl have uploaded my Mathcad worksheet?
Aug 12, 2014
11:48 AM
- Mark as New
- Bookmark
- Subscribe
- Mute
- Subscribe to RSS Feed
- Permalink
- Notify Moderator
Please log in to access translation
Aug 12, 2014
11:48 AM
JOHN WOODGATE wrote:
Thank you. I don't understand your reference to 'live data'. Do you mean that I shoudl have uploaded my Mathcad worksheet?
Exactly that! Either your original sheet, or, if it contains confidential data or is simply so large and confusing a simple trimmed down dummy sheet.
We ike to have something to play with and it usually makes more clear what exactly you are after.
Aug 12, 2014
09:13 AM
- Mark as New
- Bookmark
- Subscribe
- Mute
- Subscribe to RSS Feed
- Permalink
- Notify Moderator
Please log in to access translation
Aug 12, 2014
09:13 AM
JOHN WOODGATE wrote:
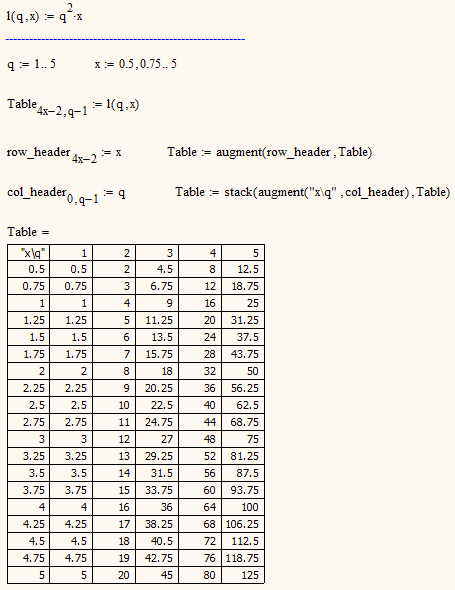
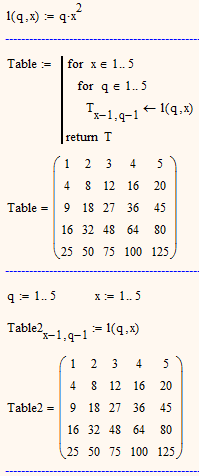
I have a fairly complex formula for I(q,x) and I want to tabulate the results with q values (1 - 5) as the columns and x values (1 to 5) as the rows. I've no doubt it's very easy, but I can't see how to do it.
Maybe something like the two approaches attached?
If the values for x and/or q are not in ascending order with step size 1, different approaches are necessary. If thats an issue, ask again. Also, if you would like to have rudimentary row and column headers.
Aug 12, 2014
11:29 AM
- Mark as New
- Bookmark
- Subscribe
- Mute
- Subscribe to RSS Feed
- Permalink
- Notify Moderator
Please log in to access translation
Aug 12, 2014
11:29 AM
Thank you very much. These are simple enough even for little me to understand. I probably only need to do this once, so no refinement is really necessary.
Aug 12, 2014
10:45 AM
- Mark as New
- Bookmark
- Subscribe
- Mute
- Subscribe to RSS Feed
- Permalink
- Notify Moderator
Please log in to access translation
Aug 12, 2014
10:45 AM
As explained above here is a more general approach by defining a utility routine and providing the row and column values as vectors. The function is assumed to have two independend arguments and the table created would have the first argmuent for the rows and the second for the columns. As your function seems to be defined the other way round, you will have to create am auxiliary function.
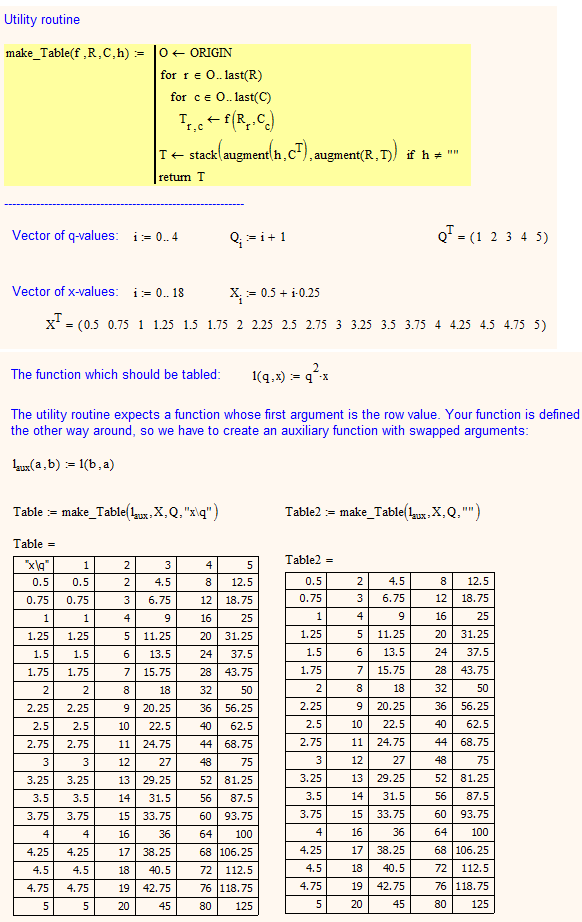
I am not including the worksheet as we still don't know which version of the program you are actually using.
Aug 12, 2014
11:35 AM
- Mark as New
- Bookmark
- Subscribe
- Mute
- Subscribe to RSS Feed
- Permalink
- Notify Moderator
Please log in to access translation
Aug 12, 2014
11:35 AM
This, too, is not too difficult for me, but maybe more than I require. I'm using Mathcad 15 at present. Thank you very much.
How can I retrieve your worksheet/ I can screen-grab, of course, but I wonder f there is a better way.
Aug 12, 2014
11:45 AM
- Mark as New
- Bookmark
- Subscribe
- Mute
- Subscribe to RSS Feed
- Permalink
- Notify Moderator
Please log in to access translation
Aug 12, 2014
11:45 AM
JOHN WOODGATE wrote:
This, too, is not too difficult for me, but maybe more than I require. I'm using Mathcad 15 at present. Thank you very much.
How can I retrieve your worksheet/ I can screen-grab, of course, but I wonder f there is a better way.
Retrieving the sheet is easy - you simply ask for it. 
Here you are!
Aug 12, 2014
05:00 PM
- Mark as New
- Bookmark
- Subscribe
- Mute
- Subscribe to RSS Feed
- Permalink
- Notify Moderator
Please log in to access translation
Aug 12, 2014
05:00 PM
Well. I copied your script into mine, with strange results. The graphs are correct, I belive (I can check with the inverted equation, which should always give H = 0.4). But the tabled values are mostly not correct, and those that are, may be coincidence. Anyway, I've attached my worksheet for your appraisal.
Aug 12, 2014
05:25 PM
- Mark as New
- Bookmark
- Subscribe
- Mute
- Subscribe to RSS Feed
- Permalink
- Notify Moderator
Please log in to access translation
Aug 12, 2014
05:25 PM
JOHN WOODGATE wrote:
Well. I copied your script into mine, with strange results. The graphs are correct, I belive (I can check with the inverted equation, which should always give H = 0.4). But the tabled values are mostly not correct, and those that are, may be coincidence. Anyway, I've attached my worksheet for your appraisal.
The reason is that you have to switch the arguments of I(), either when you define I() or when you call it.
In your very first post you said you had a function I(q,x) and want a table with x (which is the second argument of the function) as rows. So my solutions took this for granted.
In your sheet you have defined I(x,gamma) and obviously you want a table with x (which is now the first argument of the function) as rows. So of course you have to switch the order of the arguments to get it right.
If you would use my last approach, you wouldn't need the auxiliary function for the very same reason either.
Aug 13, 2014
02:23 AM
- Mark as New
- Bookmark
- Subscribe
- Mute
- Subscribe to RSS Feed
- Permalink
- Notify Moderator
Please log in to access translation
Aug 13, 2014
02:23 AM
I apologize for the confusion. The function is defined in the two different ways in my files on the subject. Thank you very much for your patience.


