Community Tip - Did you get called away in the middle of writing a post? Don't worry you can find your unfinished post later in the Drafts section of your profile page. X
- Subscribe to RSS Feed
- Mark Topic as New
- Mark Topic as Read
- Float this Topic for Current User
- Bookmark
- Subscribe
- Mute
- Printer Friendly Page
This Value Must be A Real Number When Plotting Functions
- Mark as New
- Bookmark
- Subscribe
- Mute
- Subscribe to RSS Feed
- Permalink
- Notify Moderator
This Value Must be A Real Number When Plotting Functions
I am working on a simple harmonics lab where I need to produce four graphs. I am attempting to graph position as a function of time, acceleration as a function of time, velocity as a function of time, and total energy as a function of time. I have inputted the formulas into Mathcad, as well as inserted the plots.
When attempting to plot the functions, Mathcad produces an error stating that the value on the x-axis must be a real number. (The error is on all four plots)
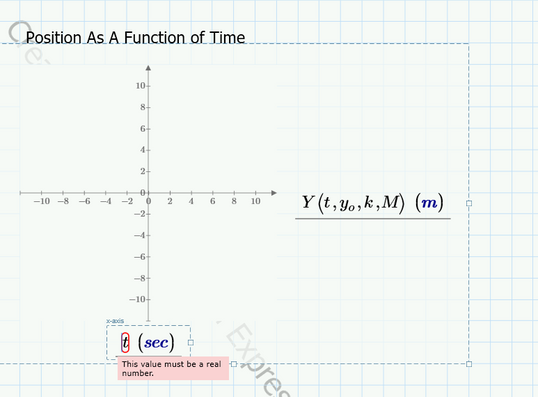
I have attempted to fix the error by changing the values for t, switching the x and y axis, using T and solving T/20 and 5*T and then inputting those values in for t, as well as working with a few different tutors, but all attempts have not corrected the issue.
Any assistance would be greatly appreciated.
Solved! Go to Solution.
- Labels:
-
Mathcad Usage
-
Physics
Accepted Solutions
- Mark as New
- Bookmark
- Subscribe
- Mute
- Subscribe to RSS Feed
- Permalink
- Notify Moderator
If possible always attach the worksheet, not just a picture showing part of it
Chances are that you did not define "M" which you use in the plot expression. Doing so would throw exact the very same error message shown in your picture.
Maybe you intended to use "mass'" instead of "M".
EDIT: Terry's reply was not shown when I started mine.
IMHO the range t is NOT the problem. There should be no need to turn it into a vector as suggested by Terry even though it would do no harm in case of your functions (they would all be vectorized implicitely automatically as far as I see).
Best guess still is that you wanted to use "mass'" and not "M" when you call the function "Y" in your plot.
And, yes, the error message sure is misleading, not helpful and flags the wrong position. We may call this a bug in Prime.
Flagging the "M" in the function call with a "Variable is not defined" message would be the correct way to handle this problem.
- Mark as New
- Bookmark
- Subscribe
- Mute
- Subscribe to RSS Feed
- Permalink
- Notify Moderator
Hi can you upload your worksheet.
The problem is "t" is a range variable not a real.
It may be as simple as adding an equal sign after definition of t
I notice M is not defined.
Cheers
Terry
- Mark as New
- Bookmark
- Subscribe
- Mute
- Subscribe to RSS Feed
- Permalink
- Notify Moderator
Hi,
Putting an equal sign after definition of "t" turns it into a real column vector with units.
Energy equation has terms t^2 that will perplex Prime as squaring two column vectors is not possible.
It is required to define element by element calculation by vectorizing either in the definition of the energy function or on the graph.
Cheers
Terry
- Mark as New
- Bookmark
- Subscribe
- Mute
- Subscribe to RSS Feed
- Permalink
- Notify Moderator
If possible always attach the worksheet, not just a picture showing part of it
Chances are that you did not define "M" which you use in the plot expression. Doing so would throw exact the very same error message shown in your picture.
Maybe you intended to use "mass'" instead of "M".
EDIT: Terry's reply was not shown when I started mine.
IMHO the range t is NOT the problem. There should be no need to turn it into a vector as suggested by Terry even though it would do no harm in case of your functions (they would all be vectorized implicitely automatically as far as I see).
Best guess still is that you wanted to use "mass'" and not "M" when you call the function "Y" in your plot.
And, yes, the error message sure is misleading, not helpful and flags the wrong position. We may call this a bug in Prime.
Flagging the "M" in the function call with a "Variable is not defined" message would be the correct way to handle this problem.
- Mark as New
- Bookmark
- Subscribe
- Mute
- Subscribe to RSS Feed
- Permalink
- Notify Moderator
Changing mass' to M solved the issue. I also have another question: tau is intended to produce a symbol (e.x. a diamond) on each plot at its defined position, (4 sec), and the symbol is also supposed to change each time the value for tau is changed. How would I add this to each plot? I have also attached the full worksheet. The problem in question is problem two, problem one is a separate problem.
- Mark as New
- Bookmark
- Subscribe
- Mute
- Subscribe to RSS Feed
- Permalink
- Notify Moderator
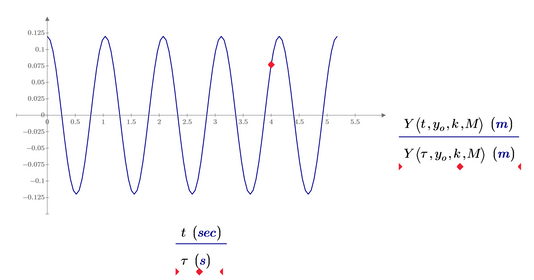
Looking for something like this?
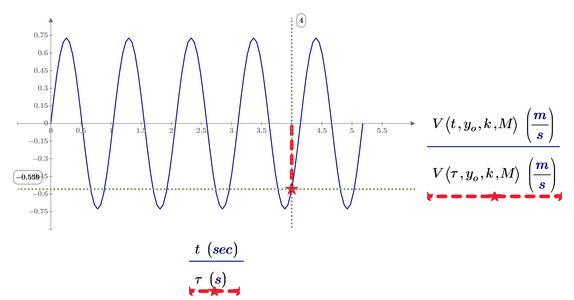
You may also make it look like this by using the stem plot and adding horizontal and vertical lines
- Mark as New
- Bookmark
- Subscribe
- Mute
- Subscribe to RSS Feed
- Permalink
- Notify Moderator
The top graph is what is being looked for. I added the second trace to each graph, but the only difference is my plot has a row of diamonds instead of one singular diamond.
- Mark as New
- Bookmark
- Subscribe
- Mute
- Subscribe to RSS Feed
- Permalink
- Notify Moderator
@AS_10562569 wrote:
The top graph is what is being looked for. I added the second trace to each graph, but the only difference is my plot has a row of diamonds instead of one singular diamond.
Can't guess what the cause may be without seeing the sheet
- Mark as New
- Bookmark
- Subscribe
- Mute
- Subscribe to RSS Feed
- Permalink
- Notify Moderator
- Mark as New
- Bookmark
- Subscribe
- Mute
- Subscribe to RSS Feed
- Permalink
- Notify Moderator
Look cloesely at my posted sheet or the posted screenshot.
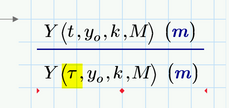
You have to use V(tau,...) for the second trace and NOT V(t,....)
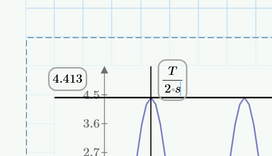
EDIT: In the plots where you added the vertical and horizontal markers for the amplitude values - you should not use absolute numbers here! If you look at my sheet (second plot) you see that I use "tau/s" in the placeholder for the vertical marker. If the focus is off, you see the value nut if you click on the marker you see the expression.
So for instance in the pot of function A(...) you should place T/(2 s) in the placeholder for the vertical marker and y.o*k/M*s^2/m in the placeholder for the horizontal line. That way the plot changes the correct way if you change some of he input values.
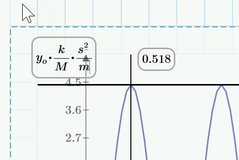
BTW, its a pity that we cannot use units here but have to make unitless scalars by dividing by the appropriate unit.
- Mark as New
- Bookmark
- Subscribe
- Mute
- Subscribe to RSS Feed
- Permalink
- Notify Moderator
Got it! I will fix the markers. Thank you for the help!
- Mark as New
- Bookmark
- Subscribe
- Mute
- Subscribe to RSS Feed
- Permalink
- Notify Moderator
Hi,
The variable used for the plot marker should not have units only a value
Highlight the plot,
Go to menu Plots | Markers | Add Vertical Marker,
Marker is placed at right end of axis with that end of axis value.
Delete value and put in tau symbol.
marker will snap to tau value and will show tau value not tau symbol.
Change tau value in equation and markers will move.
The help on this is excellent
Cheers
Terry
- Mark as New
- Bookmark
- Subscribe
- Mute
- Subscribe to RSS Feed
- Permalink
- Notify Moderator
Put tau/s instead of tau at the place of 4 of the plot.


