
Turn on suggestions
Auto-suggest helps you quickly narrow down your search results by suggesting possible matches as you type.
Showing results for
Please log in to access translation
Turn on suggestions
Auto-suggest helps you quickly narrow down your search results by suggesting possible matches as you type.
Showing results for
Community Tip - You can Bookmark boards, posts or articles that you'd like to access again easily! X
Translate the entire conversation x
Please log in to access translation
Options
- Subscribe to RSS Feed
- Mark Topic as New
- Mark Topic as Read
- Float this Topic for Current User
- Bookmark
- Subscribe
- Mute
- Printer Friendly Page
To Solve 3 variables in Mathcad Program
Mar 30, 2013
01:47 AM
- Mark as New
- Bookmark
- Subscribe
- Mute
- Subscribe to RSS Feed
- Permalink
- Notify Moderator
Please log in to access translation
Mar 30, 2013
01:47 AM
To Solve 3 variables in Mathcad Program
Dear All Experts,
at the moment i have a situation on assessing a cylidrical pipe compressive buckling study with few variables which are
1) external pressure
2) compressive force
3) pipe length.
i have manage to obtain a sets of effective axial force by considering 1) and 2) variables in an equation. End up with a sets of tables whereby values in row is due to external pressure variation and column is due to compressive force variation.
later i need to check the allowable buckling force which dependet on 3rd variables which is the length 3)
Finally i need to compare both allowable and calculated effective axial force. How can i do it in a mathcad without doing it manually.
in attached spreadsheet i did put some remark for better understanding.
Appreciate your help and at the moment please ignore the theory on concept of the study in the spreadsheet.
Thank you
-Akmal-
Solved! Go to Solution.
Labels:
- Labels:
-
Physics
ACCEPTED SOLUTION
Accepted Solutions
Mar 31, 2013
03:00 PM
- Mark as New
- Bookmark
- Subscribe
- Mute
- Subscribe to RSS Feed
- Permalink
- Notify Moderator
Please log in to access translation
Mar 31, 2013
03:00 PM

28 REPLIES 28
Mar 30, 2013
03:24 AM
- Mark as New
- Bookmark
- Subscribe
- Mute
- Subscribe to RSS Feed
- Permalink
- Notify Moderator
Please log in to access translation
Mar 30, 2013
03:24 AM
1. Density of sea water (IAPWS formulation) - http://twt.mpei.ru/MCS/Worksheets/WSP/SeaWater.xmcd
Mar 30, 2013
05:13 AM
- Mark as New
- Bookmark
- Subscribe
- Mute
- Subscribe to RSS Feed
- Permalink
- Notify Moderator
Please log in to access translation
Mar 30, 2013
05:13 AM
If I understand correct what your intend is the following small function should do the job.
Mar 30, 2013
05:23 AM
- Mark as New
- Bookmark
- Subscribe
- Mute
- Subscribe to RSS Feed
- Permalink
- Notify Moderator
Please log in to access translation
Mar 30, 2013
05:23 AM
I have added the construction of a table or for all values in the attached
Mar 30, 2013
09:55 AM
- Mark as New
- Bookmark
- Subscribe
- Mute
- Subscribe to RSS Feed
- Permalink
- Notify Moderator
Please log in to access translation
Mar 30, 2013
09:55 AM
Dear Werner,
wow your spreadsheet really a sophisticated one which i'm not sure how to read it anyway really thanx.
just to clarify with you.....
1) what is for example b=0 represent? and the statement from column 0, row 1 to column 9 row 10 which from my values does it represents?
2) if say i want to plot a trend graph between the compressive force vs length that start to say "yes" (with a selected external pressure say 0.5MPa) can i still do that?
Thank you again
Regards
-Akmal-
Mar 30, 2013
10:56 AM
- Mark as New
- Bookmark
- Subscribe
- Mute
- Subscribe to RSS Feed
- Permalink
- Notify Moderator
Please log in to access translation
Mar 30, 2013
10:56 AM
wow your spreadsheet really a sophisticated one which i'm not sure how to read it anyway really thanx.
I think the tricky parts in the makeTable routine are mainly to get some kind of "header/separator" text.
As I use stack to construct the matrix row by row I need a row to start with (thats the dummy one) which I have to get rid of at the end (submatrix). An alternative would have been an if statement before the stack command
1) what is for example b=0 represent? and the statement from column 0, row 1 to column 9 row 10 which from my
values does it represents?
If you want to keep that table you will have to provide a text which makes more sense, here.
These lines are meant to separate the 10 different 10x10 matrices. b=0 means the matrix you get when you compare all values in the matrix S (S_a1) with the first value in the vector b (bl1) - the on with index 0.
I didn't know if making that table would make any sense at all,but at least I guessed, that you wanted to compare the whole matrix S_a1 (not only the first two columns you did manually) with every value in matrix bl1, making a total of 1000 yes/no's. Hope this was right. There are other methods to present those values, nested vectors, matrices which show the comparison of a single column of S_a1 to the vector bl1, etc.
2) if say i want to plot a trend graph between the compressive force vs length that start to say "yes" (with a selected external pressure say 0.5MPa) can i still do that?
Not sure what you mean. Lets put it down to my mathematical level. The compressive force you are speaking of are the 100 values in matrix S_a1? These values should be on the ordinate axis? Which of them? I guess only a single row, as this are the values related to a specific pressure (depending on the values of P.r.) What should be on the abscissa? The values of Le which are used to calculate bl1?
What about that pressure 0.5 MPa you mentioned. Its not a value in your vector P.r, so the values for this pressure are not represented in the matrix S_a1. Are you after some kind of interpolation?
Anyway, can you be more precise and maybe give an example. We are talking about a 2-dimensional diagram, aren't we?
Mar 30, 2013
04:50 PM
- Mark as New
- Bookmark
- Subscribe
- Mute
- Subscribe to RSS Feed
- Permalink
- Notify Moderator
Please log in to access translation
Mar 30, 2013
04:50 PM
I gave your sheet a second look and think I guessed what you ar looking for. See the attached.
But the compressive forces are much larger than the range (up to 1kN) you provided! Is there something wrong?
Or should we restrict the graph to the values in your sheet and switch the axis?

Mar 31, 2013
12:12 AM
- Mark as New
- Bookmark
- Subscribe
- Mute
- Subscribe to RSS Feed
- Permalink
- Notify Moderator
Please log in to access translation
Mar 31, 2013
12:12 AM
Dear Werner,
Actually the range i've included in the spreadsheet for all variables is just a value "pluck from the sky" as my 1st intention is to get the program work. Once it works then only i go in detail to suit with my expected condition within malaysian water.
BTW yes i'm looking at a 2-dimensional diagram for the study so that easier to present and explained to my client.
After looking at your impressive programming provided in "CompBuck_3" and after giving a thought on what you have questioned me, below are the summary that i'm looking for. But1st need to seek your confirmation on whether my interpretation of the program is correct. So below is a trend graph i pick up from your provided graph and ammend it a little bit.
1) b(x)/kN value is alowable compressive value that we expected for this pipe (consider the thickness,E value and etc) with pipe length variation. Am I right?
2) The S line value for example (S(0.2MPa,x)/kN), is the axial force calculated (considering variation of length and compressive force).Am I right?
3) So when this 2 line intersect it is the max point, whereby beyond this point the pipe is expected to buckle. Am I right?
4) If all of these 3 condition satisfied, then this is a graph trend that i'm looking for but how can I know at the intersect point what will be the value of the pipe length and compressive force associated with it? have a look on my attached mathcad for better understanding.
Mar 31, 2013
05:31 AM
- Mark as New
- Bookmark
- Subscribe
- Mute
- Subscribe to RSS Feed
- Permalink
- Notify Moderator
Please log in to access translation
Mar 31, 2013
05:31 AM
I'll try to answer your questions but let me say at frst that I have no idea of the technical background your sheet is all about. I see it from a pure mathematical point of view and am using YOUR equations - if they a faulty I even won't spot it (apart from a discrepancy in units probably).
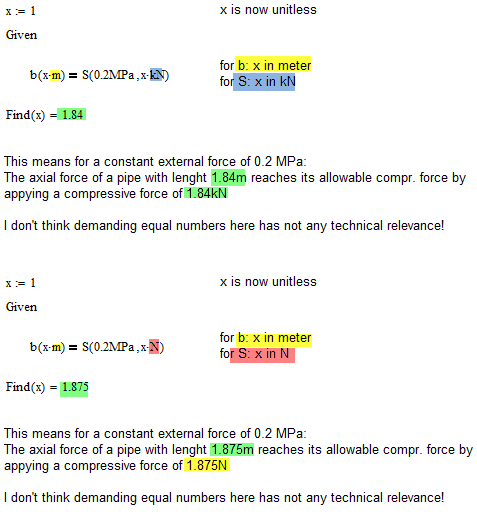
ad1) & 2) I dont think the technical meaning is as you say. My functions S and b use the same formulas and should yield the same values as your matrix S_a1 and your vector bl1. So you are wrong concerning S. The second parameter is what you called Comp in your worksheet and which, I guessed, is the compressive force, not a lenght. You had never provided a formula which caclulates S dependent of the lenght. As with b I think you are wrong, too, its what you called bl1 (allowable buckling load) and I dont think its the compressive force but the max allowable buckle force (I think you called it that way) - or is this meant to be the same?. Being lazy by nature a have chosen short names, though. I have modified the formulas so I can write the functions in one line and hope I didn't make any mistakes there. I've checked some values and they seemed OK, but of course you will have to look over the whole thing carefully yourself. To be able to quickly look at different sections in the sheet without too much scrolling I inserted those collapsable areas for my convenience.
BTW, you have deleted the table section and the one in which you calculated the matrix S_a1. This renders the "Manual comparison" section useless, as it uses S_a1.
In the graph you changed the variable name at the ordinate from le to x. Nothing bad about that, but you will have noticed that the calculation of the graphs takes much longer now. This is because x is an unknow variable and Mathcad uses its convenient quickplot feature. It will (internally) create a range variable for x and uses much more values for that than I had done in my range variable le (which was only meant for plotting). Therefore now there are much more values calculated (which I think does not add much to he qualitiy of the plot).
ad 3) I have not the slightest idea what your tubes will do if you apply more pressure. As I understood from my math point of view its this point you are after (your "yes/no" check), so I calculated it.
ad 4) Again - the responsibility for technical correctness is up to you. The problem we faced here was that we compare two physical values (S and b) but you want to graph two others (lenght and comp) which are related. It took me some time to find out from your formulas how they all connect and to be sure I used two different ways to get the desired plot.
the first was: chose a lenght and calculate the value of comp for which the appropriate b and S values (constant P) get equal. So I solved the equation S(P,comp)=b(lenght) for comp, which one can easily do analytically, and have obtained a function which calculates the force comp for any given length.
I did it the other way round and this time it was not so easy to solve S(P,comp)=b(lenght) for lenght, so I uses a numerical solve block to do the work. The resulting graphs seemed to be identical with those created by the first method, so I was happy.
In your new worksheet the plot does not seem to make much sense, as of your misinterpretation of the functions S and b.
The red graph shows the change of your max buckle force and x is interpreted as length here. But the functions S reperesend what you called the axial force and x is interpreted as compression force here, according to the formulas you provided. So I think it does not make much sense to calculate the intersection of those graphs.
So conclusive it seems you will have to go over your formulas again, especially realizing which physical values are dependent on which. It looks now to me as if you don't need Mathcad help in the first place.
Mar 31, 2013
06:24 AM
- Mark as New
- Bookmark
- Subscribe
- Mute
- Subscribe to RSS Feed
- Permalink
- Notify Moderator
Please log in to access translation
Mar 31, 2013
06:24 AM
Werner Exinger wrote:
I'll try to answer your questions but let me say at frst that I have no idea of the technical background your sheet is all about. I see it from a pure mathematical point of view ...
There is a story. A balloon floats away in the clouds. The crew caught sight of a man and shouted: «Where are we?» — « You are in a basket.» It was an answer of a mathematician. Only a mathematician could give an absolutely right and absolutely useless answer.
Mar 31, 2013
07:48 AM
- Mark as New
- Bookmark
- Subscribe
- Mute
- Subscribe to RSS Feed
- Permalink
- Notify Moderator
Please log in to access translation
Mar 31, 2013
07:48 AM
Valery Ochkov wrote:
Werner Exinger wrote:
I'll try to answer your questions but let me say at frst that I have no idea of the technical background your sheet is all about. I see it from a pure mathematical point of view ...
There is a story. A balloon floats away in the clouds. The crew caught sight of a man and shouted: «Where are we?» — « You are in a basket.» It was an answer of a mathematician. Only a mathematician could give an absolutely right and absolutely useless answer.
You know that this story is not at an end there, as the mathematician reasons that the ballon crew has to be a bunch of managers, Why? You see, they don't know where they are, they don't know where to go, the only thing which keeps them going is hot air and they expect the mathematician to solve their problem. At the end they are in the same position as before, but somehow now they can blame the mathematician for that.
Math is a tool like a pair of rose scissors - if you don't know where and when to cut the roses, don't blame the tool. 😉
Mar 31, 2013
10:19 AM
- Mark as New
- Bookmark
- Subscribe
- Mute
- Subscribe to RSS Feed
- Permalink
- Notify Moderator
Please log in to access translation
Mar 31, 2013
10:19 AM
Continuation of this dialogue:
- Sorry - we need to know our origin. Our navigator broke! Do you have one?
- 0.123654231 rad - north latitude and 0.322456765678790 rad - west longitude
This is again a mathematician - only mathematics work with radians, not degrees.
Mar 31, 2013
08:09 AM
- Mark as New
- Bookmark
- Subscribe
- Mute
- Subscribe to RSS Feed
- Permalink
- Notify Moderator
Please log in to access translation
Mar 31, 2013
08:09 AM
Dear Werner,
sorry to put you in a hassle.....really greatful for your help.
Anyway put it this way actually all 3 of my function question are what they are really, therefore:
1) YES. b(x)/kN value is alowable compressive. This will be RED line
2) YES. The S line value for example taken (S(0.2MPa,x)/kN), is the axial force (compressive force + hydrostatic force) calculated. BLUE line.
Here if these 2 lines intersect we can get the value for length (x) at this intersect point. So how can i do that.
Thank you
Mar 31, 2013
08:12 AM
- Mark as New
- Bookmark
- Subscribe
- Mute
- Subscribe to RSS Feed
- Permalink
- Notify Moderator
Please log in to access translation
Mar 31, 2013
08:12 AM
Sorry and another thing for example taken (S(0.2MPa,x)/kN), how can i read what value as the BLUE line intersect the Y-axis.
thank you
Mar 31, 2013
09:54 AM
- Mark as New
- Bookmark
- Subscribe
- Mute
- Subscribe to RSS Feed
- Permalink
- Notify Moderator
Please log in to access translation
Mar 31, 2013
09:54 AM
Akmal Hamzah wrote:
Sorry and another thing for example taken (S(0.2MPa,x)/kN), how can i read what value as the BLUE line intersect the Y-axis.
thank you
?? Set x=0 and let evaluate?
Mar 31, 2013
08:25 AM
- Mark as New
- Bookmark
- Subscribe
- Mute
- Subscribe to RSS Feed
- Permalink
- Notify Moderator
Please log in to access translation
Mar 31, 2013
08:25 AM
sorry to put you in a hassle.....really greatful for your help.
No problem, but I thought I have to put things right as I got the impression that you got the impression I knew what you were talking about
2) YES. The S line value for example taken (S(0.2MPa,x)/kN), is the axial force (compressive force + hydrostatic force) calculated. BLUE line.
NO!!!!!!!! Or, OK, yes. Its the axial force, but the second parameter (x) is NOT the length in this function S but the compressive force. Please look at the definition of S. So again, it would not make sense calculating the intersection. What would the result x be? A length (as for b(x)) or a force (as for S(P,x))?
And correctly if you try to find a solution using a solve block Mathcad throws an error because of a conflict with the units (x cannot be length and force at the same time). So you can't do that.
The axial force (unless I overlooked something) is according to your sheet NOT dependable of the length of the pipe, only of the compressive force (and the to be seen as constant external force P).
The problem (again) is, that you compare/set_equal S and b which are both forces and so thats OK. But S is dependable on the compressive force (and not the length) and b is dependable on the pipe length.
So we have the two ways sketched in my sheet:
1) chose a length, calculate b, calculate the compressive force from b=S
2) chose a compr. force, calculate S and then find the length so that b=S.
The first one being easier as the equation b=S is easier to solve for compr. than for length.
Please compare again the definitions from your original sheet (green) with the functions I defined:


Mar 31, 2013
09:03 AM
- Mark as New
- Bookmark
- Subscribe
- Mute
- Subscribe to RSS Feed
- Permalink
- Notify Moderator
Please log in to access translation
Mar 31, 2013
09:03 AM
While it is possible to let Mathcad intersect the two graphs you demanded, the picture should illustrate why I think that this would not make any sense (and in the cenclusive sentence ther is one negation too much ;-):
Mar 31, 2013
10:06 AM
- Mark as New
- Bookmark
- Subscribe
- Mute
- Subscribe to RSS Feed
- Permalink
- Notify Moderator
Please log in to access translation
Mar 31, 2013
10:06 AM
Dear Werner,
Yes I've got your point now. When i ammend the graph from the one you plot earlier ( b(x) vs x and (S(0.5MPa,x)/kN) vs x) thought that both x represent the same thing as the x has a unit of 1/m. But actually it is not.
Maybe in the first place i'm being to ambitious to resolve the puzzle with 3 variables in one go. Anyway if this the case it is better to stick with max of 2 variables for example compressive force and pipe length.
Anyway the approach of the study suppose to be a straight foward one whereby first we calculate the allowable buckle load/force . Then we calculate the axial force (which contain compressive force and hydrostatic force), then we can determine the length at which both forces intersect.
But the problem is when i want to take a step further whereby since allowable buckle load/force is related to length, why not i make it variable. Further on i make compressive force variable and as a input. Up to this part it still going to give a reasonable result.
But as i want to make the hydrostatic force variable as well, here is where the haywire starts.
Anyway i'll have a look back on mathcad you've provided earlier and try to work my way to make it happen.
If not possible as you said then i'll have to work on with different approach such as to have only 2 variables and and make the external pressure a single value input.
Thanx again Werner
P/S if say you do have any other idea pop up to your mind let me know
Mar 31, 2013
10:28 AM
- Mark as New
- Bookmark
- Subscribe
- Mute
- Subscribe to RSS Feed
- Permalink
- Notify Moderator
Please log in to access translation
Mar 31, 2013
10:28 AM
I see that the confusion stems from one of my plots on the right side. I should have deleted that scribble page, sorry.
I am a little bit confused now as its absolutely not clear what the (new?) goal is now. I think the problem of calculating for each length the maximal compressive force allowed for a given external force has been solved as well as the opposite (compr --> length).
The only problem at last was when you tried to verify my results and got confused over the meaning of the x.
The hydrostatic force you mentioned is a newly introduced value?
Don't think that making more valies variable is too ambitious but its important to clearly state what should be the given input and what the output.
And if at the end we want a 2-dimensional plot, we have to specify 1 input and 1 output.
Mar 31, 2013
11:02 AM
- Mark as New
- Bookmark
- Subscribe
- Mute
- Subscribe to RSS Feed
- Permalink
- Notify Moderator
Please log in to access translation
Mar 31, 2013
11:02 AM
No the hydrostatic force is a component in the axial force which obtain from this formula for example.
The goal that i want to achieve :
allowable buckling load/force will depend on pipe length
at what length the calculated axial force (with compressive force variable) will intersect/equal with the allowable buckling load/force
forget about the hydrostatic force variation which suppose to be as below
Mar 31, 2013
11:13 AM
- Mark as New
- Bookmark
- Subscribe
- Mute
- Subscribe to RSS Feed
- Permalink
- Notify Moderator
Please log in to access translation
Mar 31, 2013
11:13 AM
at what length the calculated axial force (with compressive force variable) will intersect/equal with the allowable buckling load/force
But thats exactly what I had done (in two different ways) - at least thats what I thought.
I am speaking of the le vs comp respective comp vs le diagrams and the functions "cmin" and "lmin". Think those function should have been better named cmax and lmax as they return the maximal allowed c (compression force) for a given length or the maximal allowed length for a given compression force.
I think i had in mind that these values are the FIRST where "no" switches to "yes" and have named them min for that reason.
Mar 31, 2013
11:43 AM
- Mark as New
- Bookmark
- Subscribe
- Mute
- Subscribe to RSS Feed
- Permalink
- Notify Moderator
Please log in to access translation
Mar 31, 2013
11:43 AM
Yes......it is the
"I think i had in mind that these values are the FIRST where "no" switches to "yes""
Ok 1st thing tommorow morning i'll have a look back on the "cmin" and "lmin" you put it earlier.
Mar 31, 2013
12:12 PM
- Mark as New
- Bookmark
- Subscribe
- Mute
- Subscribe to RSS Feed
- Permalink
- Notify Moderator
Please log in to access translation
Mar 31, 2013
12:12 PM
At some distance things become a bit easier sometimes.
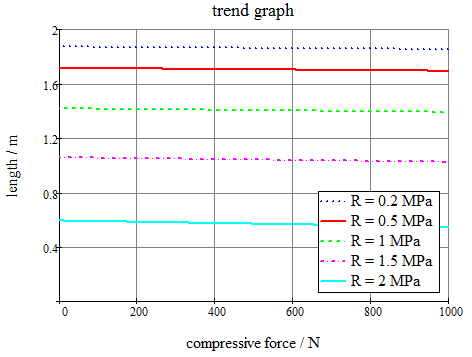
The axial force is the simple sum of the compressive force and a constant force which is dependable on the external force P only. So the maximal allowed compr. force for a given P is the difference between b(length) and that constant force.
This means that all of these graphs are identical to b(lenght), which we get for P=0, apart from an offset in negative ordinate direction.
The graph was taken from http://communities.ptc.com/servlet/JiveServlet/download/201142-49383/CompBuck_3.xmcdz.zip
Don't know why I had written R instead of P in the legend.

Mar 31, 2013
03:00 PM
- Mark as New
- Bookmark
- Subscribe
- Mute
- Subscribe to RSS Feed
- Permalink
- Notify Moderator
Please log in to access translation
Apr 01, 2013
03:21 AM
- Mark as New
- Bookmark
- Subscribe
- Mute
- Subscribe to RSS Feed
- Permalink
- Notify Moderator
Please log in to access translation
Apr 01, 2013
03:21 AM
Dear Werner,
Generally YES, this is the answer i'm looking for. Thanx
In the first as i said earlier on i'm being too ambitious is to have this result generated automatically. But unfortunate it creates haywire and almost lost my way.
Regards
-Akmal-
Apr 01, 2013
03:34 AM
- Mark as New
- Bookmark
- Subscribe
- Mute
- Subscribe to RSS Feed
- Permalink
- Notify Moderator
Please log in to access translation
Apr 01, 2013
03:34 AM
Akmal Hamzah wrote:
Dear Werner,
Generally YES, this is the answer i'm looking for. Thanx
In the first as i said earlier on i'm being too ambitious is to have this result generated automatically. But unfortunate it creates haywire and almost lost my way.
Regards
-Akmal-
Glad you are up and running again. Sometimes its hard not to loose track as to whats really needed and ever harder to explain to someone not being acquainted with the stuff.
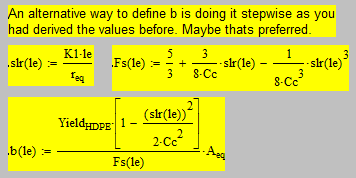
One last thing - if you feel uncomfortable with the definition of b you could of course split it in three the way you had done it originally.
Apr 01, 2013
07:49 AM
- Mark as New
- Bookmark
- Subscribe
- Mute
- Subscribe to RSS Feed
- Permalink
- Notify Moderator
Please log in to access translation
Apr 01, 2013
07:49 AM
nay bidy will tell me that i want make cigeratte packet in pro e by using bend sheet command please would you like to tell me that from where i can make it
Apr 01, 2013
07:51 AM
- Mark as New
- Bookmark
- Subscribe
- Mute
- Subscribe to RSS Feed
- Permalink
- Notify Moderator
Please log in to access translation
Apr 01, 2013
07:51 AM
kinldy please tell me that whee i can watch pro e tutorial's any good and free website tell me please sir i am doing job as a pro engineer in mechanical company
Apr 01, 2013
08:05 AM
- Mark as New
- Bookmark
- Subscribe
- Mute
- Subscribe to RSS Feed
- Permalink
- Notify Moderator
Please log in to access translation
Apr 01, 2013
08:05 AM
AGAIN - PLEASE POST IN THE RIGHT SECTION OF THIS FORUM!
You won't find pro-e help here in the Mathcad section.
As Vladimir already told you:
Please ask your question in Creo (earlier Pro/ENGINEER) community, here:
http://communities.ptc.com/community/post!input.jspa?containerType=14&container=2023


