- Subscribe to RSS Feed
- Mark Topic as New
- Mark Topic as Read
- Float this Topic for Current User
- Bookmark
- Subscribe
- Mute
- Printer Friendly Page
Trying to replicate matlab cumtrapz() function
- Mark as New
- Bookmark
- Subscribe
- Mute
- Subscribe to RSS Feed
- Permalink
- Notify Moderator
Trying to replicate matlab cumtrapz() function
Hello all,
I am trying to recreate a matlab program in mathcad and the only part I'm struggling with is finding a simple replacement for the matlab cumtrapz() function. It is explained in detail here and here.
So what I have are 2 vectors containing x and y plot points for a shear forces graph. I'd like to generate the moment plot points which involves getting the cumulative integral from one plot point to the next. I'm looking for the simplest way to do this.
A method I've found that appears to work but is a little overly complex is the following:
a := cspline(x, y)
b(x) := interp (a, x, y, c)
c := 0,1..150
f(x) := ∫-b(x) dx (integrate from 0 to x)
and then I can plot f(c) against c
Any help in simplifying is greatly appreciated. Thanks!
* I should note that I am using Prime 4.0 but don't currently have access, so screenshots will work better than files at the moment
- Mark as New
- Bookmark
- Subscribe
- Mute
- Subscribe to RSS Feed
- Permalink
- Notify Moderator
Looks about right! You could combine lines a bit:
Note that your answers may shift slightly depending on your choice of spline function. And you can use units (shear force and position to get moments.)
- Mark as New
- Bookmark
- Subscribe
- Mute
- Subscribe to RSS Feed
- Permalink
- Notify Moderator
Mathcad + Matlab = Mathlab
- Mark as New
- Bookmark
- Subscribe
- Mute
- Subscribe to RSS Feed
- Permalink
- Notify Moderator
As you are looking for a replacement for Matlabs "cumtrapz()" function - wouldn't simple linear interpolation do the job as well?
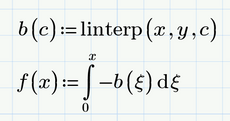
It looks like you are not looking for the vector result of cumtrapz() but rather for a continuous function. Using linear interpolation you might do it like that:
Remark: You shouldn't use the same variable as integration limit AND integration variable, therefore the xi - you may replace it by c or anything you like.
- Mark as New
- Bookmark
- Subscribe
- Mute
- Subscribe to RSS Feed
- Permalink
- Notify Moderator
Thanks, I think linterp is simpler and achieves the same thing in this case.
I don't know if this is due to the difference between how matlabs cumtrapz() and mathcads linterp() work, but I'm having an issue with my plot matching the output from the matlab program.
- Mark as New
- Bookmark
- Subscribe
- Mute
- Subscribe to RSS Feed
- Permalink
- Notify Moderator
Hi,
Your Moment plot has vertical components at each support point where it should be equal each side of support.
This means you are not allowing for unequal reaction at each support left or right. this accounts for the value on the right hand end not being zero.
Moments are usually plotted on tension side so you should plot -m to show this,
Cheers
Terry
- Mark as New
- Bookmark
- Subscribe
- Mute
- Subscribe to RSS Feed
- Permalink
- Notify Moderator
I'm still bumbling my way through this and trying to understand how some of these functions work. For now, I've gotten a bit closer by writing a program that replicates matlabs trapezoidal approximation method. Still a work in progress.
If anyone is curious, this is the program I'm trying to replicate. This post references line 149 specifically. Just for the sake of experimentation, I'm trying to use the same methods used in the matlab program but I'm certain this can be simplified a bit with mathcad functions and programming.
- Mark as New
- Bookmark
- Subscribe
- Mute
- Subscribe to RSS Feed
- Permalink
- Notify Moderator
It may help if you post your worksheet here.
But it looks you could duplicate the plot of Matlab. Primes ugly autoscaling of the axis is a drawback but you can manually scale each axis by editing the first, second and last value of the axis. To do this you will need a good eye and a steady hand 😉


