Community Tip - Did you get called away in the middle of writing a post? Don't worry you can find your unfinished post later in the Drafts section of your profile page. X
- Subscribe to RSS Feed
- Mark Topic as New
- Mark Topic as Read
- Float this Topic for Current User
- Bookmark
- Subscribe
- Mute
- Printer Friendly Page
Unable to plot 3D using Units
- Mark as New
- Bookmark
- Subscribe
- Mute
- Subscribe to RSS Feed
- Permalink
- Notify Moderator
Unable to plot 3D using Units
Unable to plot 3D graphs when the variables are linked with Units.
Without units I am able to plot the graphs.
While the equation is reveling out correctly and there is no problem and it results clean.
Attaching the source file
- Labels:
-
Mathcad Usage
-
Other
- Mark as New
- Bookmark
- Subscribe
- Mute
- Subscribe to RSS Feed
- Permalink
- Notify Moderator
Check your expression. There is a unit mismatch at least.
The Unit of L1/(C1*R1) is Ohm.
Then the unit of R1*C1/L1, below the root, is 1/Ohm (or Siemens). But the unit of 1 (also under the root), is unitless.
You cannot add a unitless number to a number with units of Ohm. (= You cannot add apples to oranges...).
Side note: You need not define j, you can use the imaginary unit i, to use it type 1i.
Success!
Luc
- Mark as New
- Bookmark
- Subscribe
- Mute
- Subscribe to RSS Feed
- Permalink
- Notify Moderator
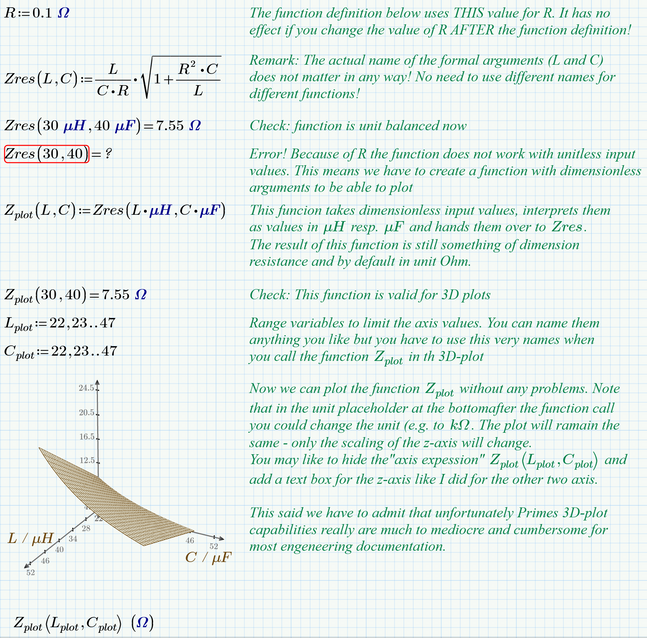
Apart from the unit mismatches Luc was pointing you to (could it be that it should read R^2 under the root and not simply R?) and apart from the strange function definition where you use a range on the RHS of the definition (which can't work) you have to be aware that in Primes 3D plots units ar allowed only for the values on the z-axis.
So the arguments of the function you try to plot must be unitless, only the function result is allowed to have a unit.
So if you work with units (which you should do) this means that the input values for your function have to be dimensionless which also often means that you have to define a dummy function (based on the original function) with dimensionless arguments just for plotting.
Here is an example:
What the plot does not show is, that the x-axis is a length in cm and the y-axis shows a length in m.
But as a first step you definitely should correct your formulas, making them unit consistent.
- Mark as New
- Bookmark
- Subscribe
- Mute
- Subscribe to RSS Feed
- Permalink
- Notify Moderator
My bad I missed the R^2. That being 1 mistake..
Apart from that I was trying if I can do the following and try it. All though it doesn't work.
I am trying to make it dimensionless,
- Tags:
- mathcad
- Mark as New
- Bookmark
- Subscribe
- Mute
- Subscribe to RSS Feed
- Permalink
- Notify Moderator
You should have looked more closely at example in the picture I posted in my last and read the explanations.
The ranges you use in 3D plot for limiting the axis must be dimensionless!
Your ranges still have units
And the function you use for plotting must accept dimensionless arguments.
Your plot function does the opposite! It accepts arguments with units, strips off the units and then calls the original function which expects proper units and would therefore fail badly.
The attached file (format P5) should help.


