- Subscribe to RSS Feed
- Mark Topic as New
- Mark Topic as Read
- Float this Topic for Current User
- Bookmark
- Subscribe
- Mute
- Printer Friendly Page
Very simple function does not run
- Mark as New
- Bookmark
- Subscribe
- Mute
- Subscribe to RSS Feed
- Permalink
- Notify Moderator
Very simple function does not run
Friends,
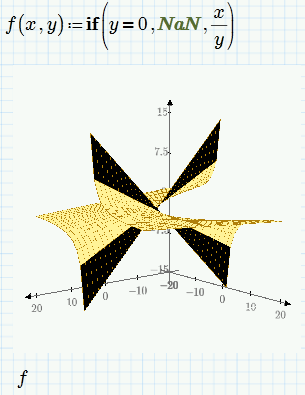
after defining f(x,y): x / y , I tried to plot as an 3D chart.
Unfortunately, that's not possbile and resulting in an error message.
Solved! Go to Solution.
- Labels:
-
Other
Accepted Solutions
- Mark as New
- Bookmark
- Subscribe
- Mute
- Subscribe to RSS Feed
- Permalink
- Notify Moderator
It doesn't like the fact that the function has a singularity when y = 0. Change the y axis start to something greater than 0.
Also, you only need type f rather than f(x,y) in the placeholder on the graph.
Alan
- Mark as New
- Bookmark
- Subscribe
- Mute
- Subscribe to RSS Feed
- Permalink
- Notify Moderator
define ranges for x and y
- Mark as New
- Bookmark
- Subscribe
- Mute
- Subscribe to RSS Feed
- Permalink
- Notify Moderator
Here is yet another approach which works in Prime only because the 3D component in Mathcad 15 and below does not accept NaN's.


