Community Tip - New to the community? Learn how to post a question and get help from PTC and industry experts! X
- Subscribe to RSS Feed
- Mark Topic as New
- Mark Topic as Read
- Float this Topic for Current User
- Bookmark
- Subscribe
- Mute
- Printer Friendly Page
What do you do when you suspect that some data is wrong?
- Mark as New
- Bookmark
- Subscribe
- Mute
- Subscribe to RSS Feed
- Permalink
- Notify Moderator
What do you do when you suspect that some data is wrong?
I spent a fair portion of my career taking measurements of experimental data. When I first started the senior engineer would review the data and discard measurements that he deemed false. Discarding data simply because you thought it was wrong struck me as very questionable and I spent a fair amount of effort developing a method (using T statistics) to identify "bad" data.
It turns out that there is a statistically rigorous calculation to do just that, developed (and published in 1852) by Benjamin Peirce. That method is developed and demonstrated in the attached Prime 4 Express file.
Thoughts and suggestions?
- Labels:
-
Statistics_Analysis
- Mark as New
- Bookmark
- Subscribe
- Mute
- Subscribe to RSS Feed
- Permalink
- Notify Moderator
W. Edwards Deming wrote a book on Statistical Process Control that addressed this subject as well. His ideas lead to the Japanese manufacturing industry going from one of the worst to one of the best in quality control.
- Mark as New
- Bookmark
- Subscribe
- Mute
- Subscribe to RSS Feed
- Permalink
- Notify Moderator
Dear Fred, Would it be possible to attach a pdf of your worksheet? Have a nice weekend.
- Mark as New
- Bookmark
- Subscribe
- Mute
- Subscribe to RSS Feed
- Permalink
- Notify Moderator
- Mark as New
- Bookmark
- Subscribe
- Mute
- Subscribe to RSS Feed
- Permalink
- Notify Moderator
Dear Fred, Thank you highly appreciated!
- Mark as New
- Bookmark
- Subscribe
- Mute
- Subscribe to RSS Feed
- Permalink
- Notify Moderator
Would your method also work in case of the data provided in this thread?
Solved: Remove specific regions from a graph - PTC Community
The built-in functions (Grubbs, GrubbsClassic, ThreeSigma) won't.
- Mark as New
- Bookmark
- Subscribe
- Mute
- Subscribe to RSS Feed
- Permalink
- Notify Moderator
Man! That's a lot of data!
First, note that Terry has successfully trimmed this.
Second, Peirce (takes the log of the inequality I'm using. I haven't been able to do that successfully. The large data set is(I think) keeping my solution from working (using the root function.)
Third, my first pass simply treated the entire set as measurements to be averaged and analyzed. Clearly there's a sinusoidal function that might reduce scatter and standard deviation.
- Mark as New
- Bookmark
- Subscribe
- Mute
- Subscribe to RSS Feed
- Permalink
- Notify Moderator
@Fred_Kohlhepp wrote:
Man! That's a lot of data!
First, note that Terry has successfully trimmed this.
Second, Peirce (takes the log of the inequality I'm using. I haven't been able to do that successfully. The large data set is(I think) keeping my solution from working (using the root function.)
Third, my first pass simply treated the entire set as measurements to be averaged and analyzed. Clearly there's a sinusoidal function that might reduce scatter and standard deviation.
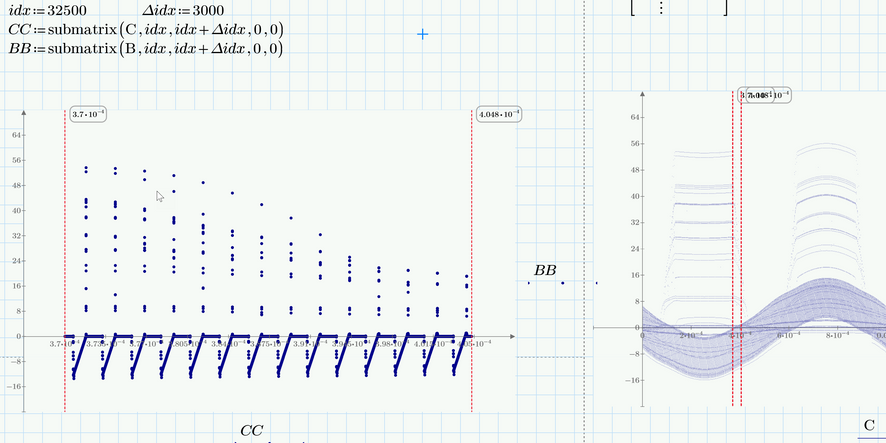
Yes, sure a huge amount of data - slightly less than 175000 data points.
As far as I understood Terry guessed(!) a sine as being the upper limit and eliminated all data above it.
I thought about automating that process by using an outlier function (without success).
If we zoom in (see picture below) we can clearly(?) see which data should be considered an outlier/spike. I thought about some kind of windowing and applying an outlier function peu à peu instead of treating all the data in one go ....?
I had not played around with that idea any further as the OP in that thread seemed to be happy with Terrys solution anyway.
The thread just came to my mind when I read your posting.
- Mark as New
- Bookmark
- Subscribe
- Mute
- Subscribe to RSS Feed
- Permalink
- Notify Moderator
I spent some more time to figure out why this system wasn't working.
The attacked file points out a major flaw: The procedure (as presented here) will not work if the data set is larger than 142 points!
Back to the drawing board!!
- Mark as New
- Bookmark
- Subscribe
- Mute
- Subscribe to RSS Feed
- Permalink
- Notify Moderator
Working to expand sample size limit, got the logarithmic equation to work. Not sure why there're still issues.
Still Prime 4 Express


