Community Tip - You can Bookmark boards, posts or articles that you'd like to access again easily! X
- Subscribe to RSS Feed
- Mark Topic as New
- Mark Topic as Read
- Float this Topic for Current User
- Bookmark
- Subscribe
- Mute
- Printer Friendly Page
Why i cannot make a graph line?
- Mark as New
- Bookmark
- Subscribe
- Mute
- Subscribe to RSS Feed
- Permalink
- Notify Moderator
Why i cannot make a graph line?
Hello, I need all of your help
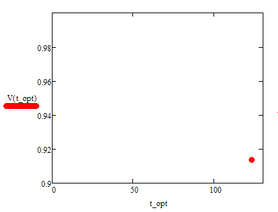
I have previously tried to make a graph line, all the formulas have been defined as well. But when I make a graph, the line of the graph doesn't appear as below, can anyone help how to fix it?
- Labels:
-
Math Homework
-
Mathcad Usage
- Mark as New
- Bookmark
- Subscribe
- Mute
- Subscribe to RSS Feed
- Permalink
- Notify Moderator
You sure should better attach your worksheet instead of posting just a picture because its quite hard to impossible to debug a picture!
We don't see how V(t) is defined but most important we don't see if you had assigned t a values before.
The coffee brew and also my crystal ball tell me that its very likely that you assigned a guess value t:=... before you used "Maximize".
So plotting V(t) over this single value t would result in plotting just one single point (which sure is hard to see).
Three possible solutions;
- Use a different variable name for the guess and in "Maximize()". You could use "t.opt" instead of just "t".
- Use a different variable like "tt" in the plot. I often use "t." (without the quotes) as variable name (thats t subscripted with no subscript at all). If the cursor is out of the region it looks exactly like a normal t but is treated as a different variable. But be aware! You can confuse yourself doing so - I know what I am talking about 😉
- (Re)Define t as a range variable in front of the plot. Something like t:=0,2..123 or t:=0,0.25..123 or whatever you think is appropriate and depending on how many points you think you need in the plot. Using a range variable is a bit more cumbersome (because you have to define it) as opposed to using the quickplot feature, but often you have a better control over the plot by using it.
BTW, do you know that Mathcad has a percentage "unit"?
Simply type V(t.opt)= and type a percentage character % in the unit placeholder after the result and you will see =91.4..%
So there should be no need to manually multiply by 100 as you did to see a percentage value.
You also can show the percentage in the plot if you type V(t)/% instead of just V(t).
- Mark as New
- Bookmark
- Subscribe
- Mute
- Subscribe to RSS Feed
- Permalink
- Notify Moderator
I'm sorry for not attaching my file, because this is my first time using this PTC community, my bad 😓
I've done the solutions step you mentioned, but it's also not working... are you have another solution?
By the way, thank you for your great tips on unit percentage! it's helped me a lot!
This is my file, thank you before!!
- Mark as New
- Bookmark
- Subscribe
- Mute
- Subscribe to RSS Feed
- Permalink
- Notify Moderator
🙂
Now t.opt is assigned a value and so if you use it in the plot, you still will plot just one single point.
If you set the line width very large you can even see the single point which is plotted
But as now t is not assigned any value anymore you can use t in the plot as you did in first place:
The point is: If you use the quick plot feature (plotting without defining the x-axis variable as a range) you can't use a variable which already was a value assigned to. You must use a "free" variable which never was assigned any value before.
I am not sure if the log-plot makes sense, but it can be seen why neither Maximize nor Minimize have any effect. Both just return the guess value because slight changes of the guess have no effect - the functions is approximately constant in that area.
When you use a guess value t.opt:=6, then Minimize returns 11.1 and Maximize -1.5*10^-6.
- Mark as New
- Bookmark
- Subscribe
- Mute
- Subscribe to RSS Feed
- Permalink
- Notify Moderator
Assume t=0,
But minimum is that by Prime 8.


