Community Tip - You can Bookmark boards, posts or articles that you'd like to access again easily! X
- Subscribe to RSS Feed
- Mark Topic as New
- Mark Topic as Read
- Float this Topic for Current User
- Bookmark
- Subscribe
- Mute
- Printer Friendly Page
auto scale function for a 2D plot is not working??
- Mark as New
- Bookmark
- Subscribe
- Mute
- Subscribe to RSS Feed
- Permalink
- Notify Moderator
auto scale function for a 2D plot is not working??
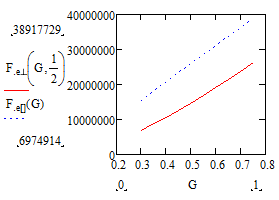
I created a 2D plot for two dependant variables and one independant variables. The plot is for dowel bearing strengths of wood loaded parallel and perpindicular to grain. The actual values loaded parallel to the grain vary from 3400 psi to 9000 psi and those perpindicular to grain vary from 1500 psi to 6250 psi. The mathad plot shows them as 10,000,000 to 40,000,000 psi

![]()
- Labels:
-
Other
- Mark as New
- Bookmark
- Subscribe
- Mute
- Subscribe to RSS Feed
- Permalink
- Notify Moderator
Its always better to attach the worksheet rather than just posting a picture.
What you see is the pressure in the standard unit Pa. It has nothing to do with "autoscale".
If you plot entities with units you can devide by the unit you would like to see.
At the ordinate write F.e(...) / psi.
Here some examples. If you don't divide by units yourself you see the result in Mathcads standard units (here m^2 and Pa):

WE
- Mark as New
- Bookmark
- Subscribe
- Mute
- Subscribe to RSS Feed
- Permalink
- Notify Moderator
Please attach your Mathcad worksheet.
- Mark as New
- Bookmark
- Subscribe
- Mute
- Subscribe to RSS Feed
- Permalink
- Notify Moderator
Werner's point is so key to understanding units in Mathcad that it bears repeating.
Mathcad calculates internally using SI units.
Although Mathcad (15 and below) has the ability to work in different quantity systems (such as CGS and US), the results may not always be what is expected due to how derived units are represented.
Look at these two examples:


Stuart


