Community Tip - You can subscribe to a forum, label or individual post and receive email notifications when someone posts a new topic or reply. Learn more! X
- Subscribe to RSS Feed
- Mark Topic as New
- Mark Topic as Read
- Float this Topic for Current User
- Bookmark
- Subscribe
- Mute
- Printer Friendly Page
calculating points on a graph
- Mark as New
- Bookmark
- Subscribe
- Mute
- Subscribe to RSS Feed
- Permalink
- Notify Moderator
calculating points on a graph
I have a question on the graphing of a function. Lets say my function f(x) is x^2+10x+2.
Now I need to write a graph of the function which is no problem.
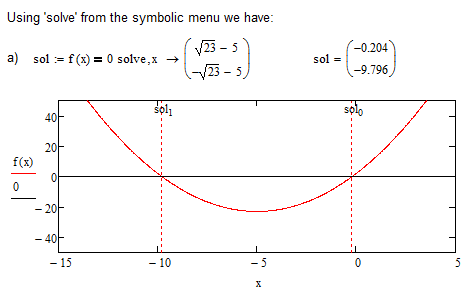
a)The second part is to make Mathcad calculate the points where the graph intersects with the x-axis.I can see from the graph what the right answers are but I cannot figure out to how to make Mathcad to calculate them?
b)I need to calculate f(25)?
c)finally, somewhat similar to part a, I need to calculate the intersection point between f(x) and y=2x+1?
Thank you for all the help you can give me!
- Labels:
-
Other
- Mark as New
- Bookmark
- Subscribe
- Mute
- Subscribe to RSS Feed
- Permalink
- Notify Moderator
- Mark as New
- Bookmark
- Subscribe
- Mute
- Subscribe to RSS Feed
- Permalink
- Notify Moderator
We can show solutions (roots of the function) on the plot by markers help:

- Mark as New
- Bookmark
- Subscribe
- Mute
- Subscribe to RSS Feed
- Permalink
- Notify Moderator
The root() function is handy for this sort of thing.
Be sure to graph the function so you can verify the solution makes sense.
- Mark as New
- Bookmark
- Subscribe
- Mute
- Subscribe to RSS Feed
- Permalink
- Notify Moderator
MichaelH wrote:
The root() function is handy for this sort of thing.
Be sure to graph the function so you can verify the solution makes sense.
One good rule.
We must at first use symbolic Math (the solve operator for example) for the solving any problem and than if symbolic Math can not solve this problem we must use numerical Math (the function root for example).


