Community Tip - If community subscription notifications are filling up your inbox you can set up a daily digest and get all your notifications in a single email. X
- Subscribe to RSS Feed
- Mark Topic as New
- Mark Topic as Read
- Float this Topic for Current User
- Bookmark
- Subscribe
- Mute
- Printer Friendly Page
chart component
- Mark as New
- Bookmark
- Subscribe
- Mute
- Subscribe to RSS Feed
- Permalink
- Notify Moderator
chart component
Has anyone figured out how to plot a vector of points using the chart component in Prime? It used to be so simple in Mathcad 15.
Solved! Go to Solution.
- Labels:
-
Mathcad Usage
Accepted Solutions
- Mark as New
- Bookmark
- Subscribe
- Mute
- Subscribe to RSS Feed
- Permalink
- Notify Moderator
Thanks for your help, Werner and Luc. After a struggle, I finally got the chart component to do what I want (sort of). Now, if they would just allow more than 50K points per trace, but I suppose that's too much to ask of a 64 BIT APPLICATION!!!!
The other quirk, which almost gave me a heart attack, is that when I go to save a worksheet that has several chart components, it makes me open and close the UI for EVERY ONE OF THEM before it will save. I can only hope that this buggy POS will be improved before my Mathcad 15 licenses run out.
- Mark as New
- Bookmark
- Subscribe
- Mute
- Subscribe to RSS Feed
- Permalink
- Notify Moderator
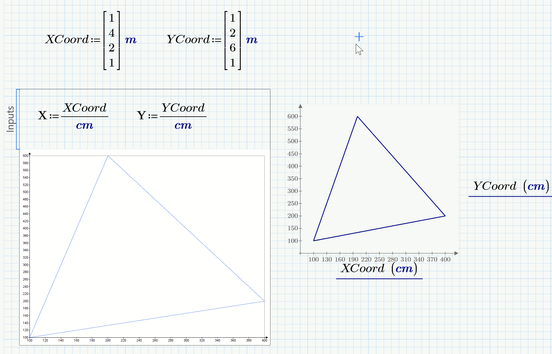
Something like this?
The far too tiny numbers in the chart component to the left are because the chart component does not scale properly if used with a higher screen resolution. Thats one of the reasons its useless for me.
I used Prime 6 but I had not heard that they would have improved something here in the newer Prime versions.
- Mark as New
- Bookmark
- Subscribe
- Mute
- Subscribe to RSS Feed
- Permalink
- Notify Moderator
Thanks Werner. I already have a (large) defined vector to plot. Just want the x-axis to be the element index of the vector and the y-axis to be the vector element values. The chart component insists upon X being a scalar.
- Mark as New
- Bookmark
- Subscribe
- Mute
- Subscribe to RSS Feed
- Permalink
- Notify Moderator
Like this:
Success!
Luc
- Mark as New
- Bookmark
- Subscribe
- Mute
- Subscribe to RSS Feed
- Permalink
- Notify Moderator
Thanks Luc. How does the function "max" you show in the third element of the "matrix" function correspond to f(i,1) = i? Seem like bizarre notation.
- Mark as New
- Bookmark
- Subscribe
- Mute
- Subscribe to RSS Feed
- Permalink
- Notify Moderator
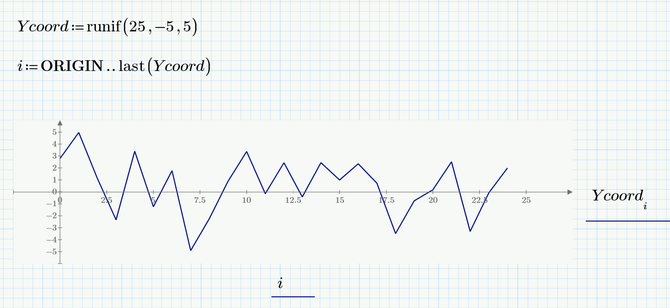
So as you still provide no example I assume that you are used to plot y[i over a range variable i, correct? Something like
And your problem is that the silly chart component does not accept a range as X?
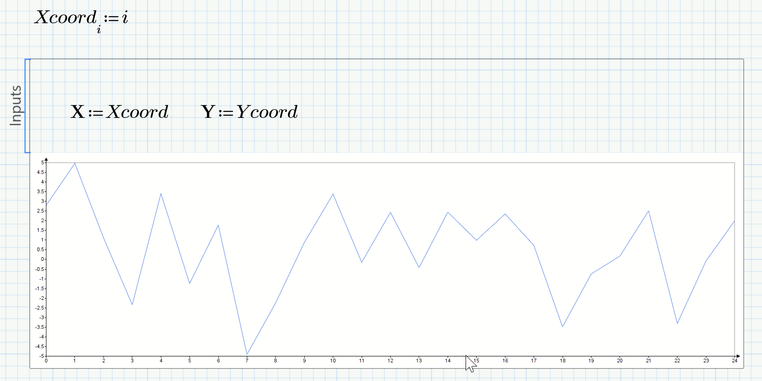
So you have to create a vector with the necessary x-values and use this vector in the chart component:
Prime 6 worksheet attached
- Mark as New
- Bookmark
- Subscribe
- Mute
- Subscribe to RSS Feed
- Permalink
- Notify Moderator
Thanks for your help, Werner and Luc. After a struggle, I finally got the chart component to do what I want (sort of). Now, if they would just allow more than 50K points per trace, but I suppose that's too much to ask of a 64 BIT APPLICATION!!!!
The other quirk, which almost gave me a heart attack, is that when I go to save a worksheet that has several chart components, it makes me open and close the UI for EVERY ONE OF THEM before it will save. I can only hope that this buggy POS will be improved before my Mathcad 15 licenses run out.
- Mark as New
- Bookmark
- Subscribe
- Mute
- Subscribe to RSS Feed
- Permalink
- Notify Moderator
After repeated buggy problems, I finally got the chart component to work. It's pretty pathetic compared to what's available in Mathcad 15, but I could make do if only they would allow more than 50K points per trace.
- Mark as New
- Bookmark
- Subscribe
- Mute
- Subscribe to RSS Feed
- Permalink
- Notify Moderator
What makes you think the Chart component is limited to 50k points per trace?
Here is one with two traces of 200k points each:
The actual limit is 2 million:
Success!
Luc
- Mark as New
- Bookmark
- Subscribe
- Mute
- Subscribe to RSS Feed
- Permalink
- Notify Moderator
From the "About Performance" in the Chart Component help menu, see the last bullet:
- Mark as New
- Bookmark
- Subscribe
- Mute
- Subscribe to RSS Feed
- Permalink
- Notify Moderator
"lose their selection layer in the chart application":
Not a big loss. Or (I'll gladly admit that) I am blind. I don't see what gets lost.
What is this 'selection layer' anyway? If I search for it in the help, the only item found is where it occurs in the "about performance".
I've tried plots with more and less than 50000 points per trace, and can find no difference in the interface.
Success!
Luc
- Mark as New
- Bookmark
- Subscribe
- Mute
- Subscribe to RSS Feed
- Permalink
- Notify Moderator
Luc,
I'm told by Mathcad technical support that this means that a secondary axis plot cannot have more than 50K data points. I haven't been able to find and definition of "selection layer" either, but it must refer to being able to select for a secondary y-axis.
- Mark as New
- Bookmark
- Subscribe
- Mute
- Subscribe to RSS Feed
- Permalink
- Notify Moderator
I haven't tried yet in the chart component but maybe thats a similar limitation as in the native Prime 2D plot. There the numbers are the same - a max of about 2 million points but if the trace has 50k points or more, you will not be able to set points/symbol, line style and thickness.
- Mark as New
- Bookmark
- Subscribe
- Mute
- Subscribe to RSS Feed
- Permalink
- Notify Moderator
I think it's worse than that. I'm told by multiple tech support folks that you cannot plot more than 50K data points on the secondary axis, period. Imbecilic to have such a limitation in a 64 bit application!
- Mark as New
- Bookmark
- Subscribe
- Mute
- Subscribe to RSS Feed
- Permalink
- Notify Moderator
Below is a Chart plot, with three traces, each of 100k points. The cosine (green trace) is plot along the Y2 axis.
I still wonder what is limited above 50 k points...
(Except of course the working with units, but that's also impossible for Chart plots of less than 50 k points per trace.)
Success!
Luc
- Mark as New
- Bookmark
- Subscribe
- Mute
- Subscribe to RSS Feed
- Permalink
- Notify Moderator
This little dialog has been quite useful. Apparently you can indeed plot more than 50K points on a secondary axis. Someone needs to tell Mathcad tech support that this constraint has been removed if it existed. Also, the confusing language re "selection layer" should be removed from the help files or else clarified as to what it means.
- Mark as New
- Bookmark
- Subscribe
- Mute
- Subscribe to RSS Feed
- Permalink
- Notify Moderator
My understanding from our conversation earlier is that you did try to plot those points, but you couldn't?
- Mark as New
- Bookmark
- Subscribe
- Mute
- Subscribe to RSS Feed
- Permalink
- Notify Moderator
I was told by Mathcad support before familiarizing myself with the chart component that you could only plot 50K points on the secondary y-axis. Last night, I tried and was able to plot more than that. The help pages are very ambiguous and confusing about this subject.
- Mark as New
- Bookmark
- Subscribe
- Mute
- Subscribe to RSS Feed
- Permalink
- Notify Moderator
I'd recommend clicking the email icon at the corner of the About Performance page to send feedback to the Documentation team, if you haven't already. To me, it reads that there's a limit of two million traces, but there is an ambiguous performance problem after 50,000 traces (whatever the selection layer is). They could clarify that.
But glad to hear that the Chart Component (while not perfect) is more powerful than you (and Support) gave it credit for!
- Mark as New
- Bookmark
- Subscribe
- Mute
- Subscribe to RSS Feed
- Permalink
- Notify Moderator
Done.
- Mark as New
- Bookmark
- Subscribe
- Mute
- Subscribe to RSS Feed
- Permalink
- Notify Moderator
Not chart component but EXCEL component can display all plots that EXCEL can do. Prime 9.


