Community Tip - If community subscription notifications are filling up your inbox you can set up a daily digest and get all your notifications in a single email. X
- Subscribe to RSS Feed
- Mark Topic as New
- Mark Topic as Read
- Float this Topic for Current User
- Bookmark
- Subscribe
- Mute
- Printer Friendly Page
combining two formulas to plot one graph
- Mark as New
- Bookmark
- Subscribe
- Mute
- Subscribe to RSS Feed
- Permalink
- Notify Moderator
combining two formulas to plot one graph
Hi all,
is it possible to combine the two graphs and formulas I have set up,
to get the two graphs they produce shown in one?
I don´t know how to solve it as the two formulas have two different boundary conditions.
Regards
Seb
Solved! Go to Solution.
- Labels:
-
Mathcad Usage
-
Mechanical_Engineering
-
Other
Accepted Solutions
- Mark as New
- Bookmark
- Subscribe
- Mute
- Subscribe to RSS Feed
- Permalink
- Notify Moderator
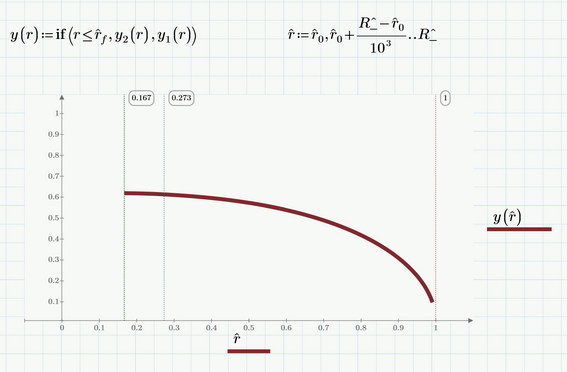
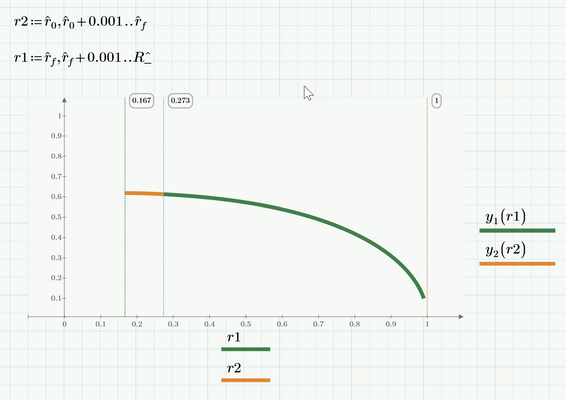
Looking for something like this?
The range variable is only needed for plotting, so it must not be defined in front of the calculations!
In case you need two distinct plots (maybe differently colored) you have to define two different range variables which of course must be named differently.
- Mark as New
- Bookmark
- Subscribe
- Mute
- Subscribe to RSS Feed
- Permalink
- Notify Moderator
Do you know how to put the results of the curve into an excel sheet in form of x and y values?
Because it worked with the values for r1 and r2 but for y1(r1) and y2(r2) it does not work out
Thank you for any help you can give me.
Regards
Seb
- Mark as New
- Bookmark
- Subscribe
- Mute
- Subscribe to RSS Feed
- Permalink
- Notify Moderator
So you prefer to stay with two different functions and two different ranges rather than using the single range with the single function y as shown in my first attempt?
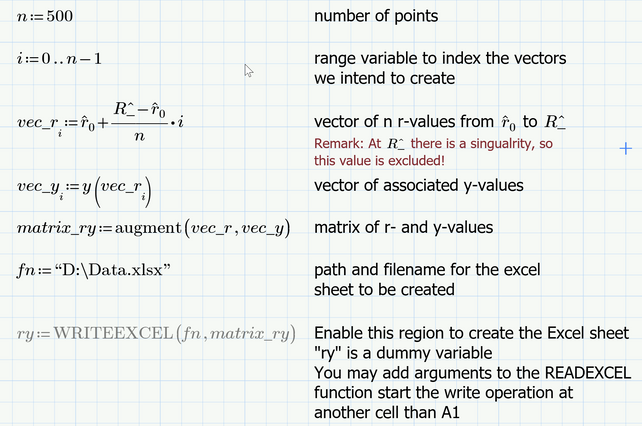
Anyway, I would use the WRITEEXCEL function to transfer values from Prime to Excel. But you can only transfer vectors and matrices, not ranges!
So you would first create the appropriate vectors for r and y values in Prime, then augment them and write it to an excel sheet.
EDIT: Here is an example what to do. I used the approach with just a single function y. To use the approach with different ranges and functions y you would have to create two vectors for r and y each and stack them.
You may use matrix_ry instead of the dummy ry to save a little bit of memory 😉
- Mark as New
- Bookmark
- Subscribe
- Mute
- Subscribe to RSS Feed
- Permalink
- Notify Moderator


