- Subscribe to RSS Feed
- Mark Topic as New
- Mark Topic as Read
- Float this Topic for Current User
- Bookmark
- Subscribe
- Mute
- Printer Friendly Page
could you give me advice again?
- Mark as New
- Bookmark
- Subscribe
- Mute
- Subscribe to RSS Feed
- Permalink
- Notify Moderator
could you give me advice again?
I posted a few days ago about same question.
But I can't understand well and I think it is not accurate about "polyfitc" when I used it.
For example,
RNodes(2.8667)>>>Aero Twst(13.308), RNodes(2.8667)>>>chord(3.532)
I want to express such as upper.
it means that they are related mutually.
when I posted such as similiar question before, I got reommendation to use "polyfit"
But it was not accurate compared to original values when I graphed.
And I got another answer, but I coudln't understand well.
so Could you help me again ?
< I need to use original values without change a little>
Solved! Go to Solution.
- Labels:
-
Other
Accepted Solutions
- Mark as New
- Bookmark
- Subscribe
- Mute
- Subscribe to RSS Feed
- Permalink
- Notify Moderator
Fred already pointed you to "linterp" in his reply in the other thread you are referring to and I guess for your case linear interpolation will be good enough.
I am not sure but I guess that the Maxwell book you are reading has a chapter on interpolation, too - right?
So why are you still not going to study the basics of Prime? After all your math background should tell you that you need some sort of interpolation as I understand your post in that way that you are not happy with a regression/approximation.
MoreoverI think you should read a bit more about the Excel component and how to use it. You don't need that component at all if you use READEXCEL as you did in your sheet.
The attached sheet should help.
- Mark as New
- Bookmark
- Subscribe
- Mute
- Subscribe to RSS Feed
- Permalink
- Notify Moderator
Please upload your worksheet.
- Mark as New
- Bookmark
- Subscribe
- Mute
- Subscribe to RSS Feed
- Permalink
- Notify Moderator
- Mark as New
- Bookmark
- Subscribe
- Mute
- Subscribe to RSS Feed
- Permalink
- Notify Moderator
Fred already pointed you to "linterp" in his reply in the other thread you are referring to and I guess for your case linear interpolation will be good enough.
I am not sure but I guess that the Maxwell book you are reading has a chapter on interpolation, too - right?
So why are you still not going to study the basics of Prime? After all your math background should tell you that you need some sort of interpolation as I understand your post in that way that you are not happy with a regression/approximation.
MoreoverI think you should read a bit more about the Excel component and how to use it. You don't need that component at all if you use READEXCEL as you did in your sheet.
The attached sheet should help.
- Mark as New
- Bookmark
- Subscribe
- Mute
- Subscribe to RSS Feed
- Permalink
- Notify Moderator
thank you to help me~
After finishing this work, I continually have a plan to study "mathcad" basic.
- Mark as New
- Bookmark
- Subscribe
- Mute
- Subscribe to RSS Feed
- Permalink
- Notify Moderator
jinsuk Lee wrote:
thank you to help me~
After finishing this work, I continually have a plan to study "mathcad" basic.
Thats the wrong way round!
- Mark as New
- Bookmark
- Subscribe
- Mute
- Subscribe to RSS Feed
- Permalink
- Notify Moderator
I have some questions about you file.
I know ORIGIN is mean.
But I can't understand well why you it use such as following picture.
could you explain for me?
- Mark as New
- Bookmark
- Subscribe
- Mute
- Subscribe to RSS Feed
- Permalink
- Notify Moderator
jinsuk Lee wrote:
Are you sure my first way using lookup() is the variant you want to chose?
I know ORIGIN is mean.
??????? What do mean by that?
But I can't understand well why you it use such as following picture.
could you explain for me?
If you look at the help for the command lookup you will see that it returns a vector of results - even if it finds only one value. I am taking th every first of those elements as you sure want to get a scalar value and not a 1x1 vector.
- Mark as New
- Bookmark
- Subscribe
- Mute
- Subscribe to RSS Feed
- Permalink
- Notify Moderator
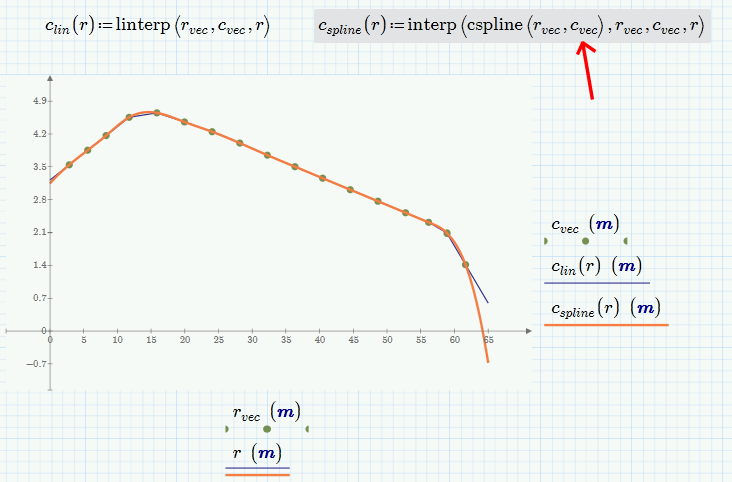
You have a copy and paste error, which is why the spline interpolation looks so ugly.

- Mark as New
- Bookmark
- Subscribe
- Mute
- Subscribe to RSS Feed
- Permalink
- Notify Moderator
Richard Jackson wrote:
You have a copy and paste error, which is why the spline interpolation looks so ugly.
I see! Thanks for pointing out.
- Mark as New
- Bookmark
- Subscribe
- Mute
- Subscribe to RSS Feed
- Permalink
- Notify Moderator
There is also an option to use a B-Spline fit if interested. I have attached a similar sheet pdf showing my work with it.
The main reason I used a B-Spline is for the continuous derivative though, and unless that is needed, a cubic spline fit should be just fine.
You can also just insert your data via copy and past using an excel component and not worry about having to read the excel file.


