Turn on suggestions
Auto-suggest helps you quickly narrow down your search results by suggesting possible matches as you type.
Showing results for
Please log in to access translation
Turn on suggestions
Auto-suggest helps you quickly narrow down your search results by suggesting possible matches as you type.
Showing results for
Community Tip - If community subscription notifications are filling up your inbox you can set up a daily digest and get all your notifications in a single email. X
Translate the entire conversation x
Please log in to access translation
Options
- Subscribe to RSS Feed
- Mark Topic as New
- Mark Topic as Read
- Float this Topic for Current User
- Bookmark
- Subscribe
- Mute
- Printer Friendly Page
create vector from function
Apr 19, 2014
05:54 PM
- Mark as New
- Bookmark
- Subscribe
- Mute
- Subscribe to RSS Feed
- Permalink
- Notify Moderator
Please log in to access translation
Apr 19, 2014
05:54 PM
create vector from function
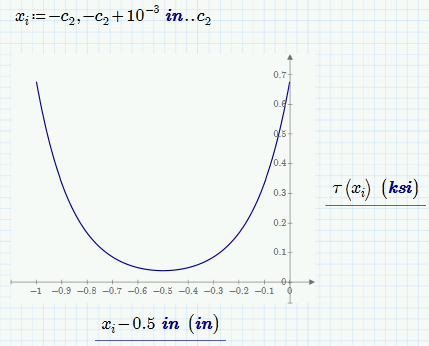
I'm sorry if this has been asked before, but I could not find the answer to my question. I have defined a function t(x), and I would like to plot its results against a different domain than the one I use to generate the range or "y" values. It seems like I may have to use the function I've created to generate an array of values, then simply plot those against an array of the same dimension with the x values I would like to plot against.
In my worksheet that I've attached, I would like to evaluate my function t(x) against the domain x_i, then use those results and plot against the domain x_plot. Thanks for any assistance.
Solved! Go to Solution.
Labels:
- Labels:
-
Other
ACCEPTED SOLUTION
Accepted Solutions
Apr 19, 2014
06:32 PM
- Mark as New
- Bookmark
- Subscribe
- Mute
- Subscribe to RSS Feed
- Permalink
- Notify Moderator
Please log in to access translation
Apr 19, 2014
06:32 PM
You have to consider that range varaibles and vectors are completely different data structures even if they may (unfortunately) look alike in Prime if you evaluate them. In fact a range is no data structure at all but just an impicit loop. Stuart Bruff had written two profound articles on the subject - I had posted then recently here http://communities.ptc.com/message/238888#238888 and you may find them very useful for Prime, too.
You correctly had realized that you would need vectors to get what you want, but you had created just range variables. If you create vectors your plot will work (See attached file).
BTW - as it seems that you simply want to shift your graph to the left by half an inch, why don't you simply plot tau(x+0.5 in)? Also see attached.
3 REPLIES 3
Apr 19, 2014
06:32 PM
- Mark as New
- Bookmark
- Subscribe
- Mute
- Subscribe to RSS Feed
- Permalink
- Notify Moderator
Please log in to access translation
Apr 19, 2014
06:32 PM
You have to consider that range varaibles and vectors are completely different data structures even if they may (unfortunately) look alike in Prime if you evaluate them. In fact a range is no data structure at all but just an impicit loop. Stuart Bruff had written two profound articles on the subject - I had posted then recently here http://communities.ptc.com/message/238888#238888 and you may find them very useful for Prime, too.
You correctly had realized that you would need vectors to get what you want, but you had created just range variables. If you create vectors your plot will work (See attached file).
BTW - as it seems that you simply want to shift your graph to the left by half an inch, why don't you simply plot tau(x+0.5 in)? Also see attached.
Apr 19, 2014
06:47 PM
- Mark as New
- Bookmark
- Subscribe
- Mute
- Subscribe to RSS Feed
- Permalink
- Notify Moderator
Please log in to access translation
Apr 19, 2014
06:47 PM
This was exactly what I was looking for, thank you very much for the quick explanation and additional information to read up on. I had initially tried to simply plot tau(x+0.5in) but was for some reason unsuccesful -- I believe I had tried to perform a "vector" shift against a range variable to no avail. Thank you again.
Apr 19, 2014
07:06 PM
- Mark as New
- Bookmark
- Subscribe
- Mute
- Subscribe to RSS Feed
- Permalink
- Notify Moderator
Please log in to access translation
Apr 19, 2014
07:06 PM
You are welcome.
I had initially tried to simply plot tau(x+0.5in) but was for some reason unsuccesful -- I believe I had tried to perform a "vector" shift against a range variable to no avail.
It works using a range, too, as I showed with x.range, but if you had used x.i and tau(x.i+0.5in) you would indeed have seen the correct shifted curve, but within -0.5 and 0.5 (range x.i) and not from -1 to 0. Thats the reason you have to define the range variable to be running from -1 to 0.
But I just realize the you could have achieved what you want by using your range x.i (works with my vector x.i, too) by shifting the values at the abscissa - that may be the more natural approach as you must neither change your x-range nor your function (call):
2